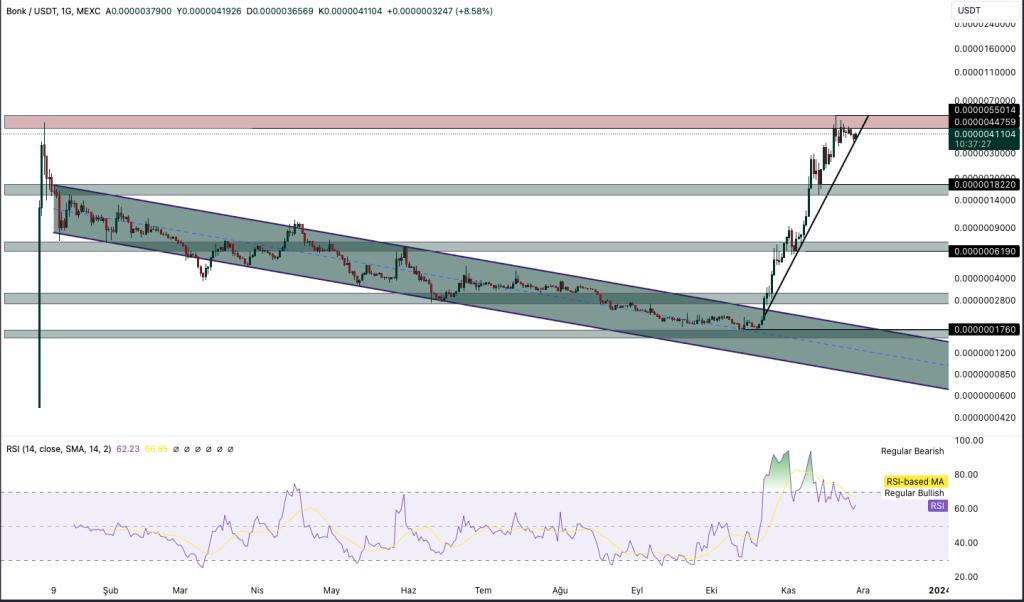
BONK price analysis, we will analyze past price movements through charts and technical indicators. We will determine support and resistance levels and guide investors in their buying and selling decisions.
The first Bonk rally, which solidified trust in the Solana ecosystem, has shown that investors are still supporting the Solana ecosystem and the project. On January 7’, we announced Bonk news, the company’s announcement of burning 5 trillion tokens, which has been listed on several exchanges and has attracted great interest. However, despite these positive developments, it has entered a sharp decline trend by forming a falling channel later.
After completing the Solana rally, Bonk unexpectedly broke its falling trend and created a strong bull trend. This situation shows that investors continue to trust the project and see its future potential. Currently, we can try to understand whether the meme coin star of the solana ecosystem can maintain its strong performance by closely examining this uptrend.
New ATH from Bonk

When we look at the chart carefully, after breaking the falling channel, it had a massive rise of %2220 and reached its historical peak. However, despite this rapid rise, there is divergence in the RSI indicator.
If we don’t expect a big drop in the overall crypto market, we can say that Bonk can maintain its rise by breaking the resistance of 0.0000055014 dollars. However, the situation of divergence in the RSI indicator attracts attention and this situation may need to find a balance.
Bonk, after ATH, is currently receiving support from its rising trend and is trying to form a new uptrend. If the positive atmosphere in the crypto market continues, we can see that it can lead to new sharp rises.
However, when we consider an alternative scenario, if it cannot cross the resistance zone, it can break its rising trend downwards and enter a sharp declining trend. In this case, the nearest support level will be 0.0000018220 dollars.


