Cardano rallies to $0.56 but data shows it may not hold on. Despite a bullish Bitcoin, the buying volume behind ADA has not kept pace suggesting that a reversal was likely.
Despite Bullish Market, Poor Buying Volume Can Start Downtrend on Cardano
The 12-hour chart for Cardano (ADA) depicts a bullish market structure, but recent indications suggest a potential bearish reversal on the horizon due to a notable absence of buying pressure.
Between February 7th and 11th, Cardano experienced a remarkable rally of 19.16%. However, this bullish momentum has encountered resistance, stalling as buyers encountered significant obstacles. Despite Bitcoin’s bullish movement, ADA’s buying volume has failed to match pace.

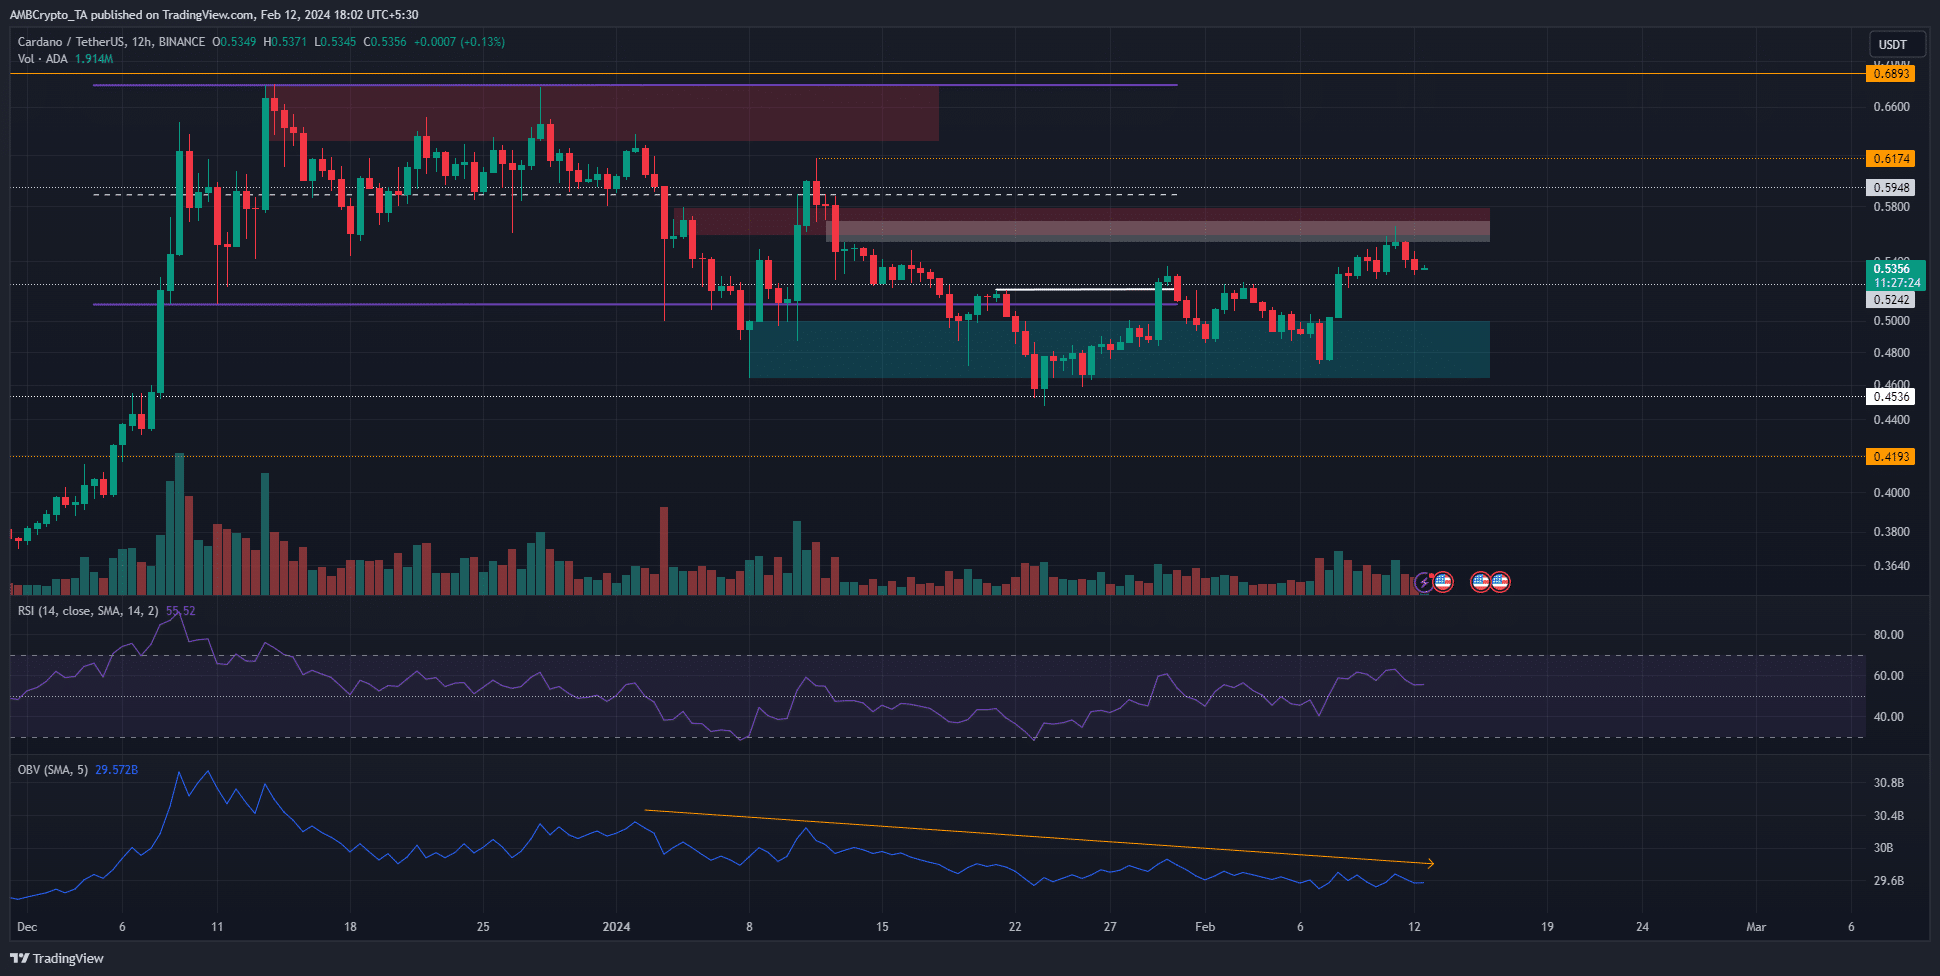
Examining the 12-hour chart, Cardano’s bullish market structure was established earlier this month with a breakthrough past $0.5205. However, the $0.56 region presents a bearish order block (red box), coinciding with a fair value gap (white box) at $0.55.
While the Relative Strength Index (RSI) remains above the neutral 50, aligning with the bullish market structure, the On-Balance Volume (OBV) has exhibited a consistent downtrend in 2024, indicating waning buying pressure despite ADA’s defense of the $0.45 support zone.7
To signal potential further bullish movement towards $0.7, ADA must surpass $0.578. Until this scenario materializes, traders may consider shorting ADA, targeting the $0.48 support zone.

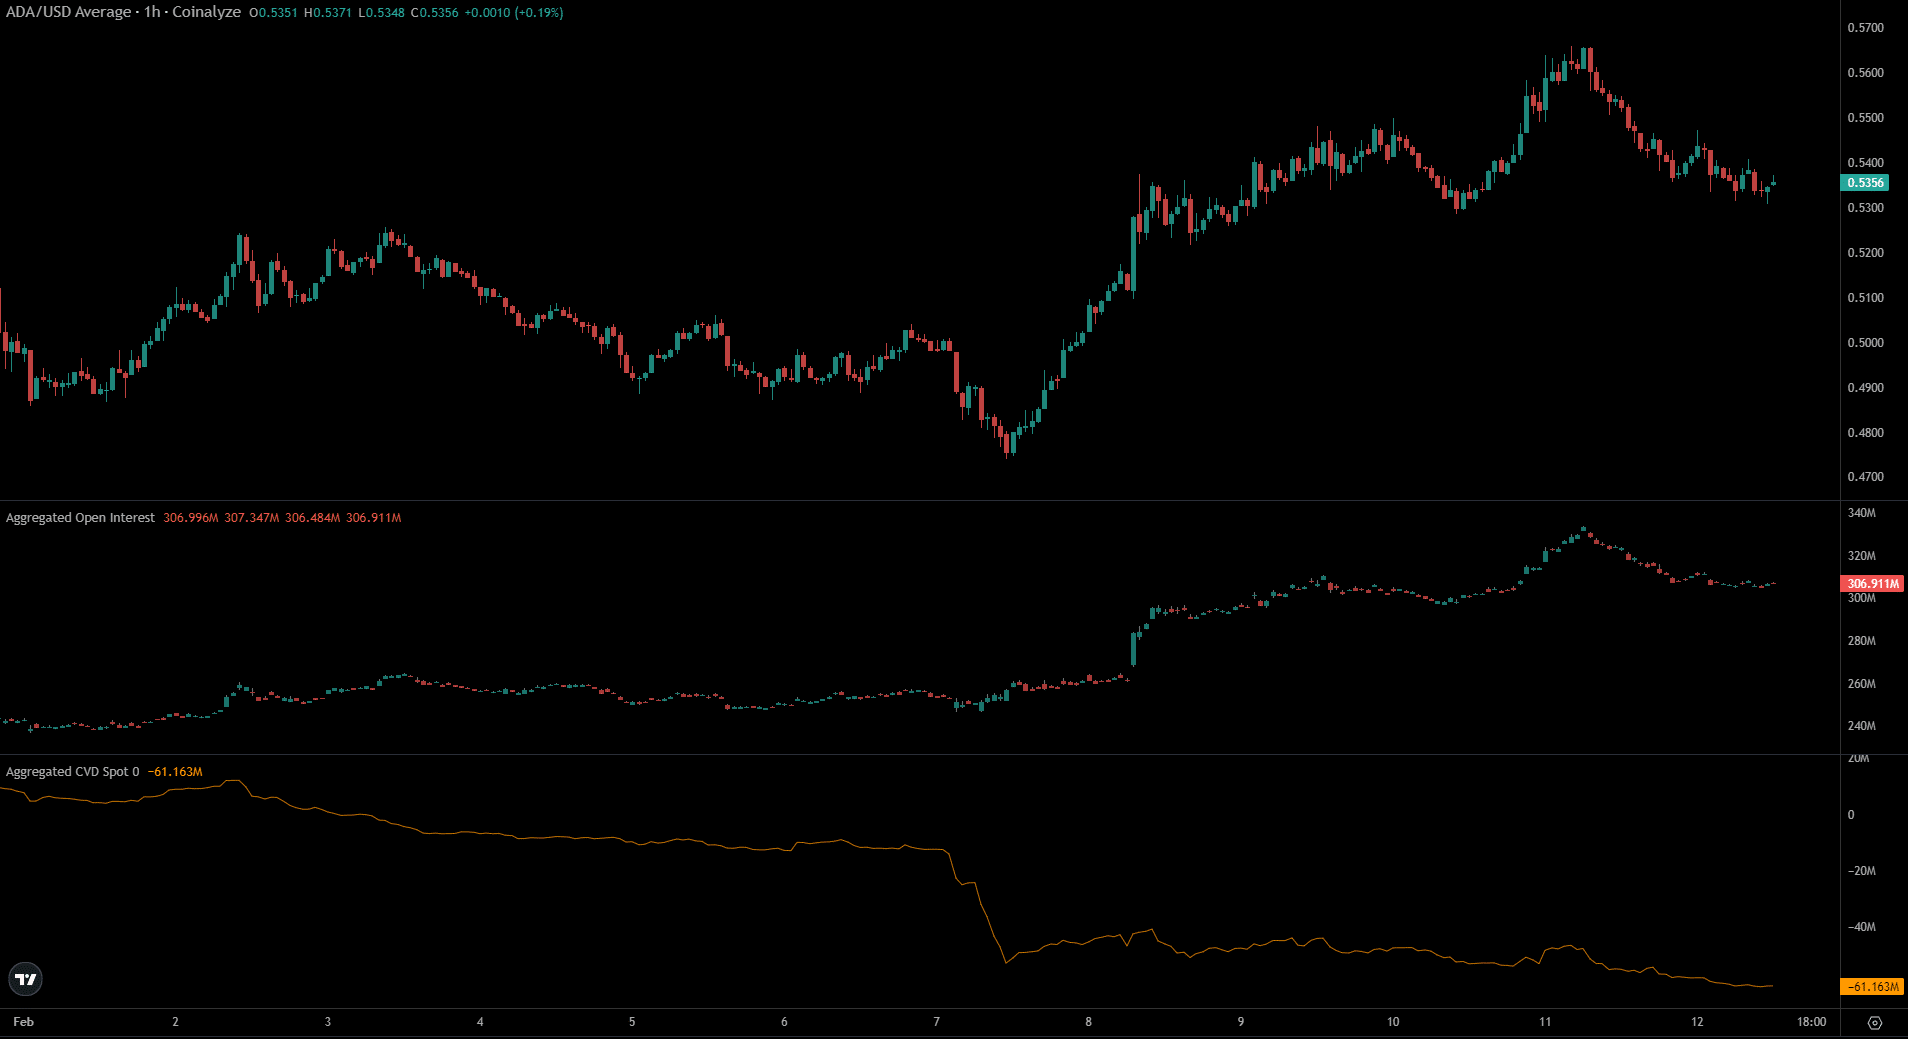
While the Open Interest chart witnessed an upward trend from February 7th to 11th alongside prices, indicating speculators’ willingness to go long, recent developments over the past 24 hours suggest a shift in sentiment. Conversely, the spot Cumulative Volume Delta (CVD) chart failed to establish an uptrend.
Similar to the OBV, spot buying activity on lower timeframes remains subdued, suggesting a probable rejection from the $0.55 region and a potential revisit to the $0.48 zone.


