Cosmos (ATOM) Chart Analysis and Price Prediction! We are evaluating the chart formation, market trends, trading volume, and potential future moves made by Cosmos (ATOM).
You might like: SEC Sues Richard Heart in Finland!
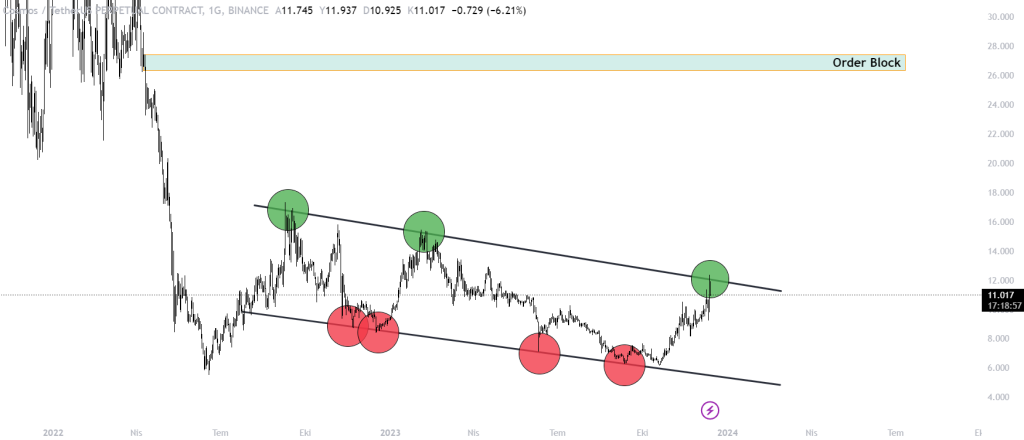
There is a descending channel formation on the Cosmos (ATOM) chart. Even if it tests the upper band momentarily, Atom continues to decline by being rejected from this level. It is worth noting that the upper band is an important resistance point for Atom. If it can break through this level and close above it, it can continue its rise to the order block at the $27 level.
If it is rejected from this level and continues to decline, we may see a pullback back to the lower band. However, it can be risky to target the lower band during the pullback because sometimes the declines can be short-lived and the uptrend can continue.
Cosmos (ATOM) is a platform and a cryptocurrency designed to enable blockchain projects to communicate with each other. Cosmos offers a network structure that facilitates interaction and data sharing between different blockchains. This allows different blockchains to communicate with each other, transfer assets, and work together.

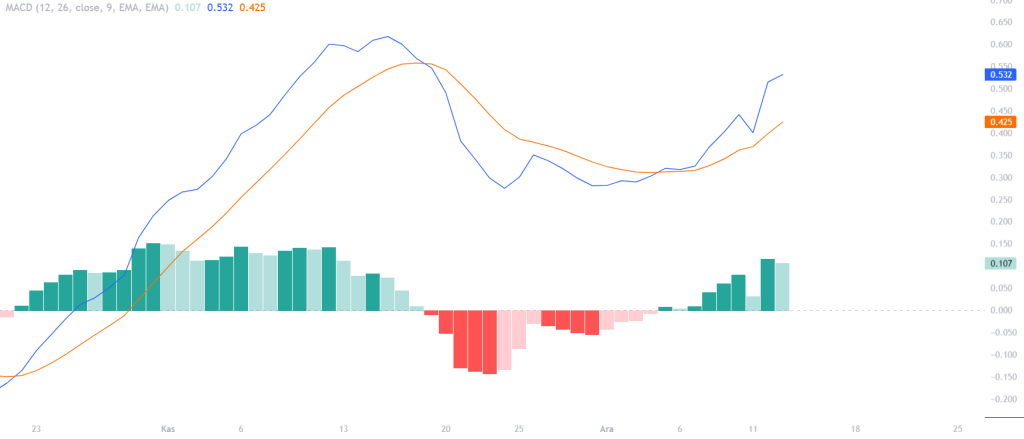
When we examine the MACD indicator for Cosmos (ATOM), we can see that there is a slight downward signal. However, this is not yet a fully accurate signal because unclosed candles are not included in the analysis. Therefore, the situation on the MACD side may remain positive before the daily candle close.

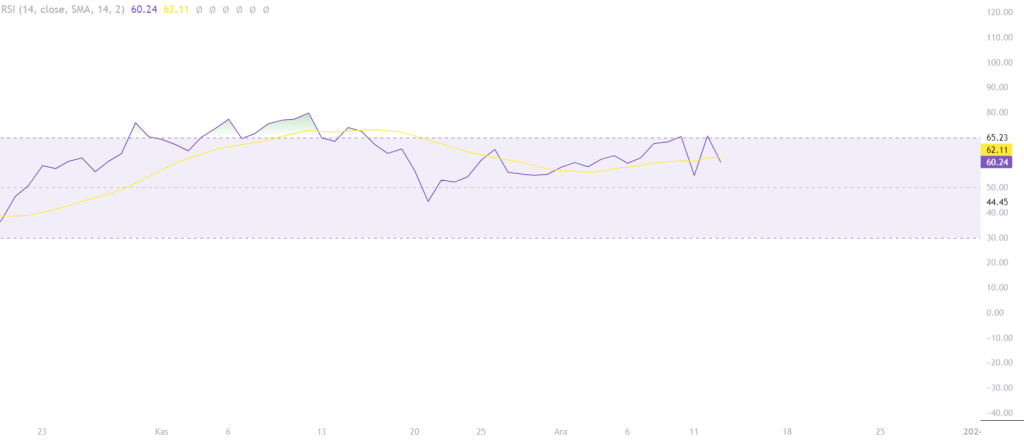
The situation with the RSI indicator in ATOM looks a bit negative. RSI rejected the upper limit of the oversold zone, 70, twice, and is currently about to break below the middle line. If the daily candle closes this way, there is a possibility that the decline will continue.

Cosmos (ATOM) Market Data
- Market Cap: $4,122,098,019 (#20 ranked)
- Daily Volume: $777,334,040 (#17 ranked, +238.42% increase)
- Daily Volume/Market Cap (24h): 15.20%
- Circulating Supply: 378,751,467 ATOM
- Total Supply: 378,751,467 ATOM
- Fully Diluted Market Cap: $4,113,153,201
You can easily buy and sell Cosmos (ATOM) tokens from global exchanges such as Binance, BitGet, Kucoin, Mexc, Houbi, and Gate.io. If you want to benefit from the discount link specially defined for Coin Mühendisi followers, you can use our referral code by clicking on the exchange you want to register for.
You can also freely share your thoughts and comments about the topic in the comment section. Additionally, don’t forget to follow us on our Telegram, YouTube and Twitter channels for the latest news and updates.


