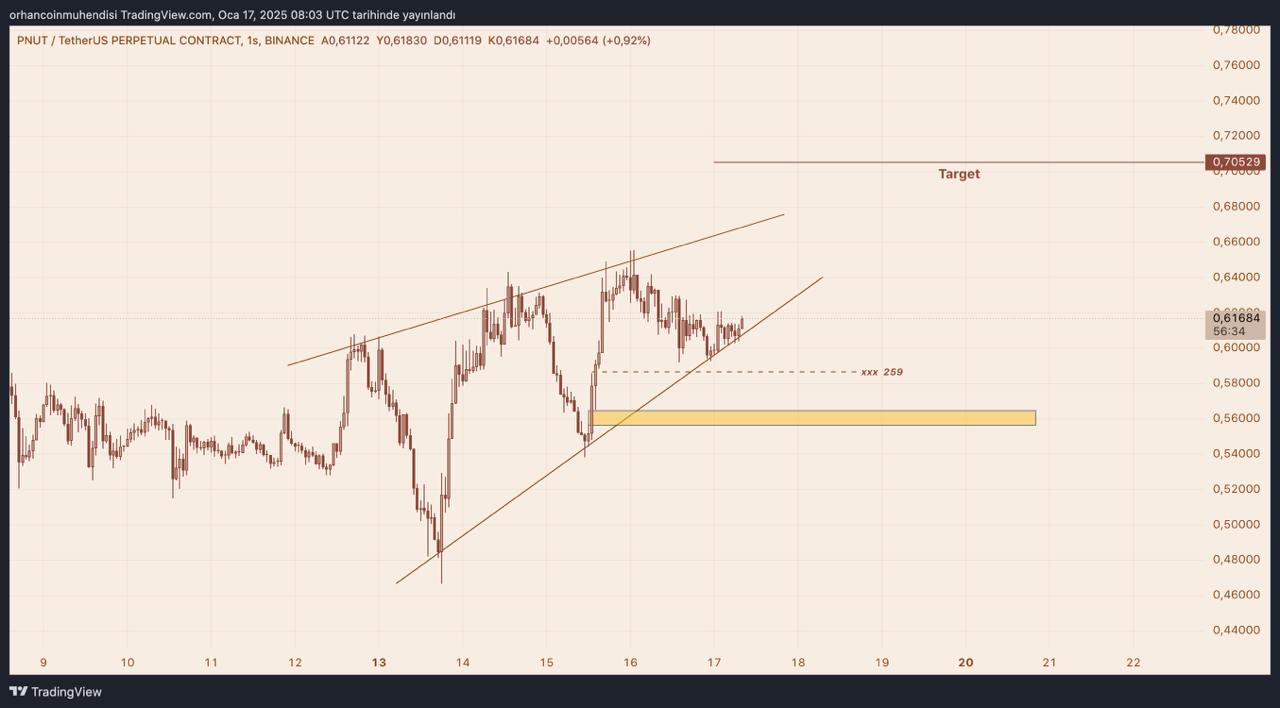
We are heading into a Friday, a day where market movement is often anticipated. Notably, the Pnut chart displays a prominent ascending wedge formation. In this article, we’ll break down Pnut’s technical outlook and highlight key points to watch.
Technical Analysis: Key Levels for Pnut
On the hourly timeframe, indicators show a positive outlook. The narrowing of the Bollinger Bands (BB) suggests that a volatile move may be imminent. Additionally, the price has reached support, and indicators are currently emitting bullish signals. However, from a broader perspective, there are some risk factors to consider.
You Might Be Interested In: Elon Musk Talks About the Name of a New Memecoin!
A significant liquidity pool has accumulated at the $0.58 level in the lower region. This increases the likelihood of the price being drawn toward this level. If liquidity is targeted, a short-term pullback may occur. Moreover, the potential for the price to fill gaps in the lower regions is another critical factor that investors should watch closely. For this reason, entering a position at the current levels carries notable risk.

Target Levels and Position Management
In the target region, it’s important to consider the upward potential of the price. Position management, including profit-taking strategies, should account for the market’s dynamic nature. Additionally, the possibility of prices reaching higher levels shouldn’t be overlooked.
In summary, while the current support level offers a short-term positive outlook, it also carries risks. The $0.58 level holds critical importance, and waiting for a pullback to this level may provide a more secure strategy. Tracking price movements in the target region is essential for effectively managing positions.
You can also freely share your thoughts and comments about the topic in the comment section. Additionally, don’t forget to follow us on our Telegram, YouTube, and Twitter channels for the latest news and updates.


