This guide dives deep into 10 essential crypto charts patterns, empowering you to analyze markets and make informed trading decisions, not just chase the latest trend.
You might like: BEAM, PEPE and HNT Price Analysis (February 13, 2024)
Beyond Technical Jargon
While mastering technical analysis takes time and practice, understanding these key patterns equips you with a valuable toolkit. Consider them building blocks for your personal trading strategy, not magic formulas for guaranteed profits.
Remember:
- Markets are complex: No single pattern guarantees success. Always consider broader market trends, news events, and risk management strategies.
- No magic bullets: Past performance doesn’t predict the future. Use these patterns as guides, not gospel.
- Practice makes perfect: Backtest and experiment with different patterns on historical data to gain confidence.
Best Crypto Charts
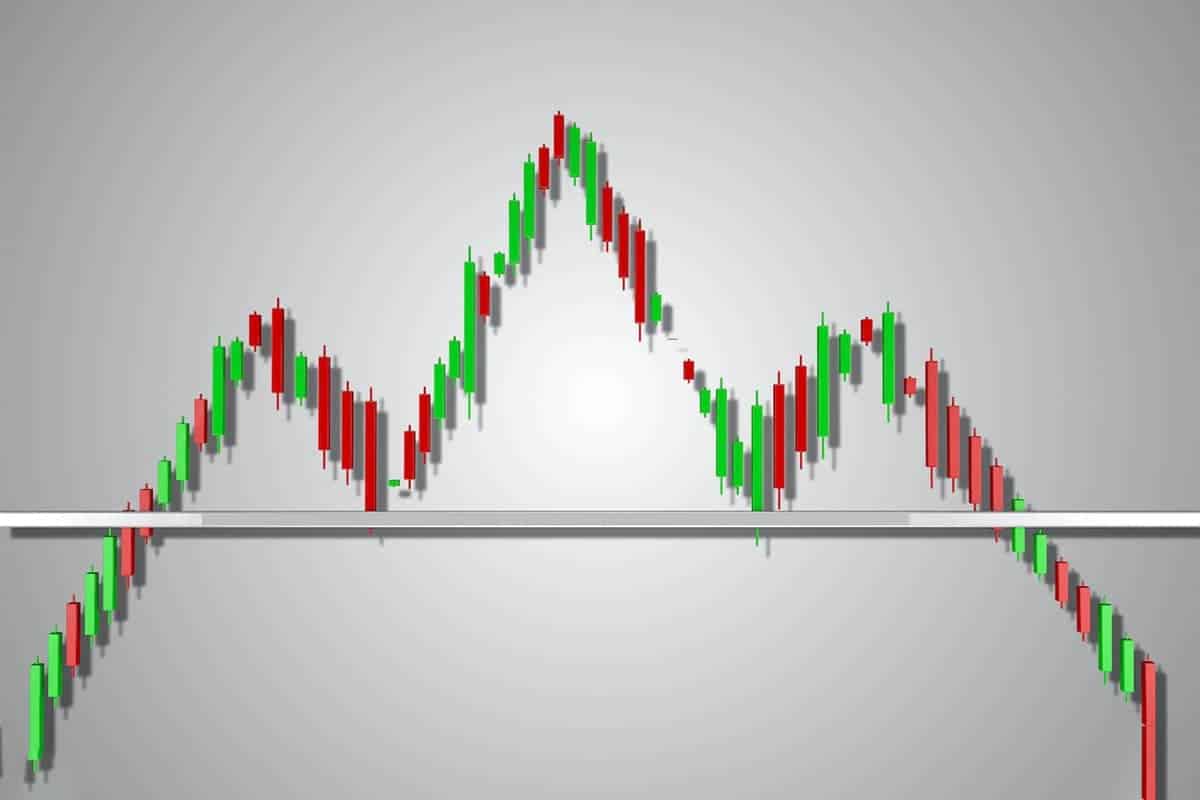
Head and Shoulders: A classic reversal pattern signaling a potential shift from bullish to bearish. Look for three peaks, with the middle one the highest, and a neckline connecting the lows. A break below the neckline confirms the downtrend.
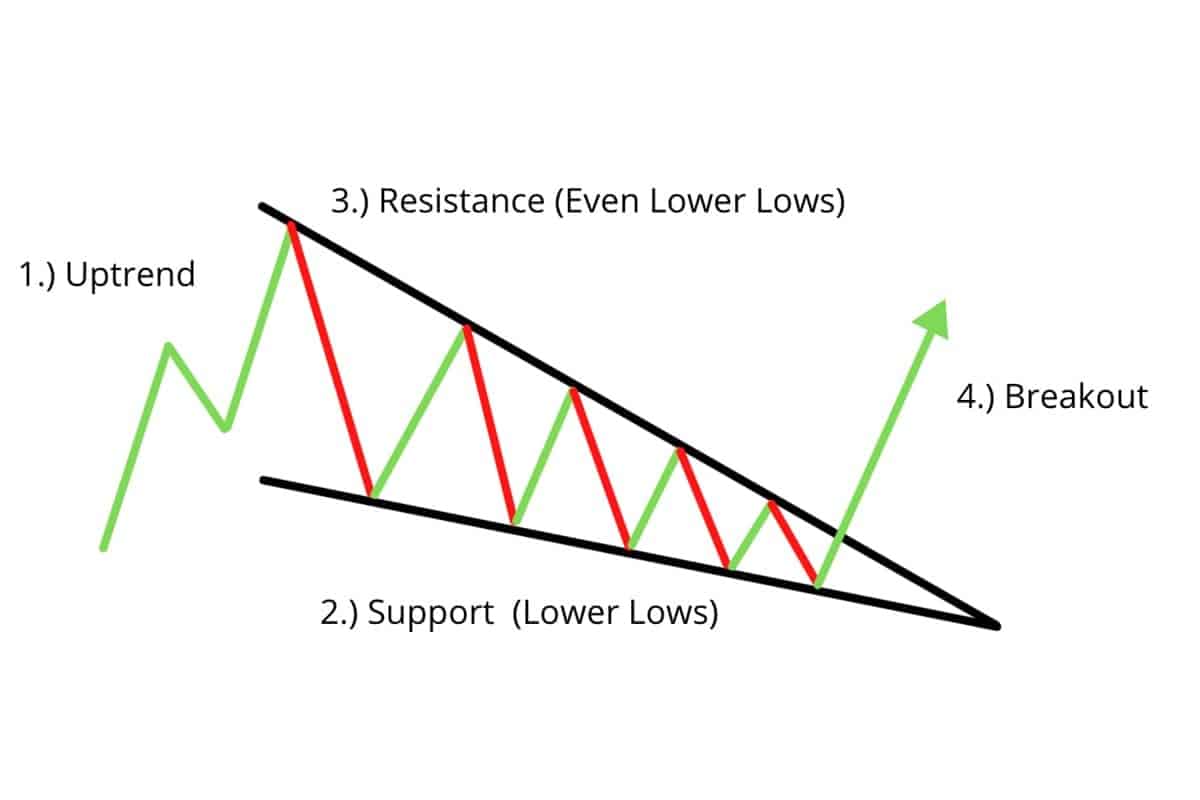
Falling Wedge: A bullish continuation pattern characterized by converging highs and lows, forming a narrowing “wedge.” It suggests the uptrend will resume after a brief consolidation.
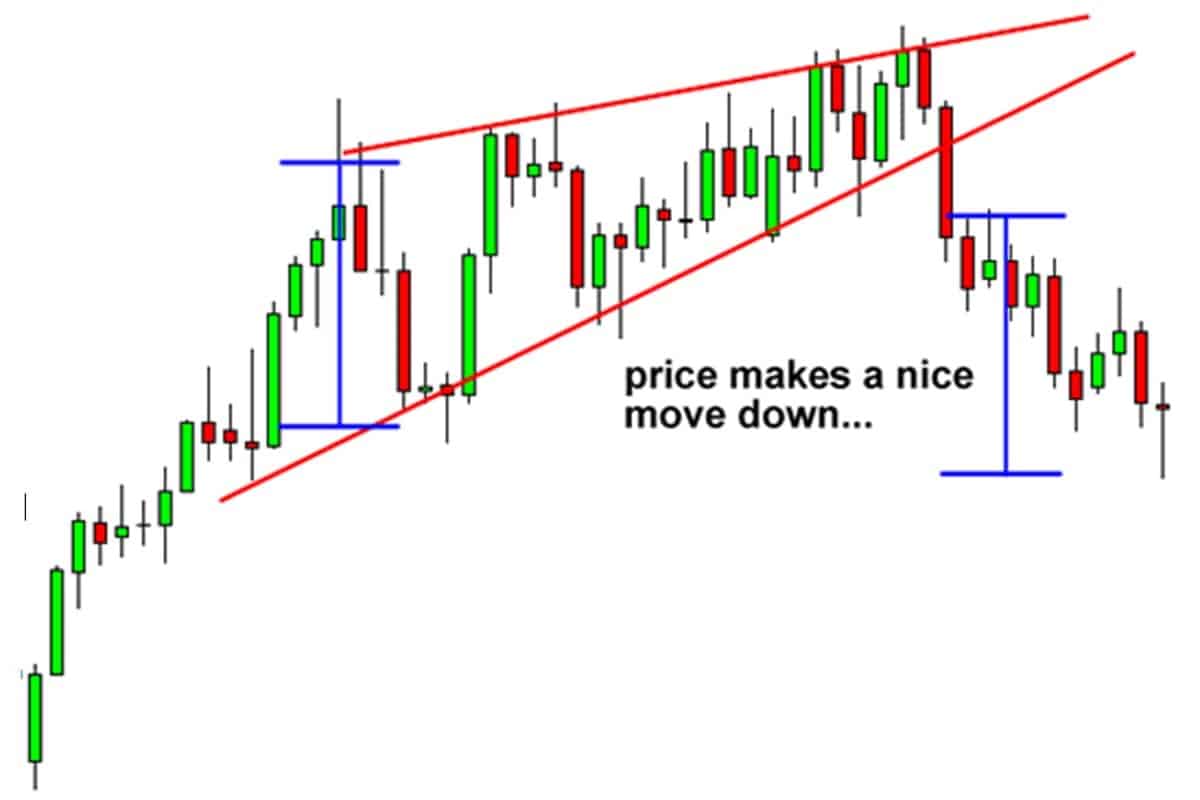
Rising Wedge: The bearish counterpart of the falling wedge, indicating a potential downtrend continuation after a consolidation period.
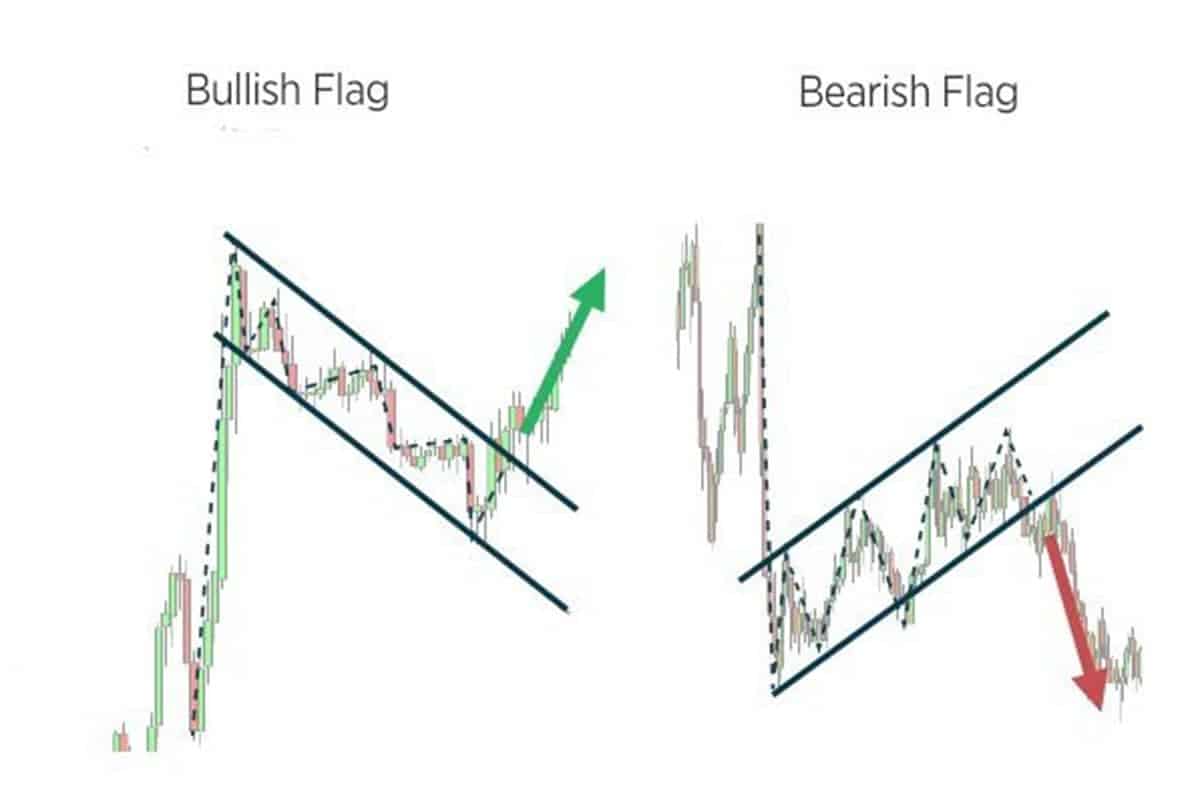
Flag Pattern: A temporary pause in a trending market, resembling a flagpole followed by a rectangular consolidation phase. A breakout above/below the flag confirms trend continuation.
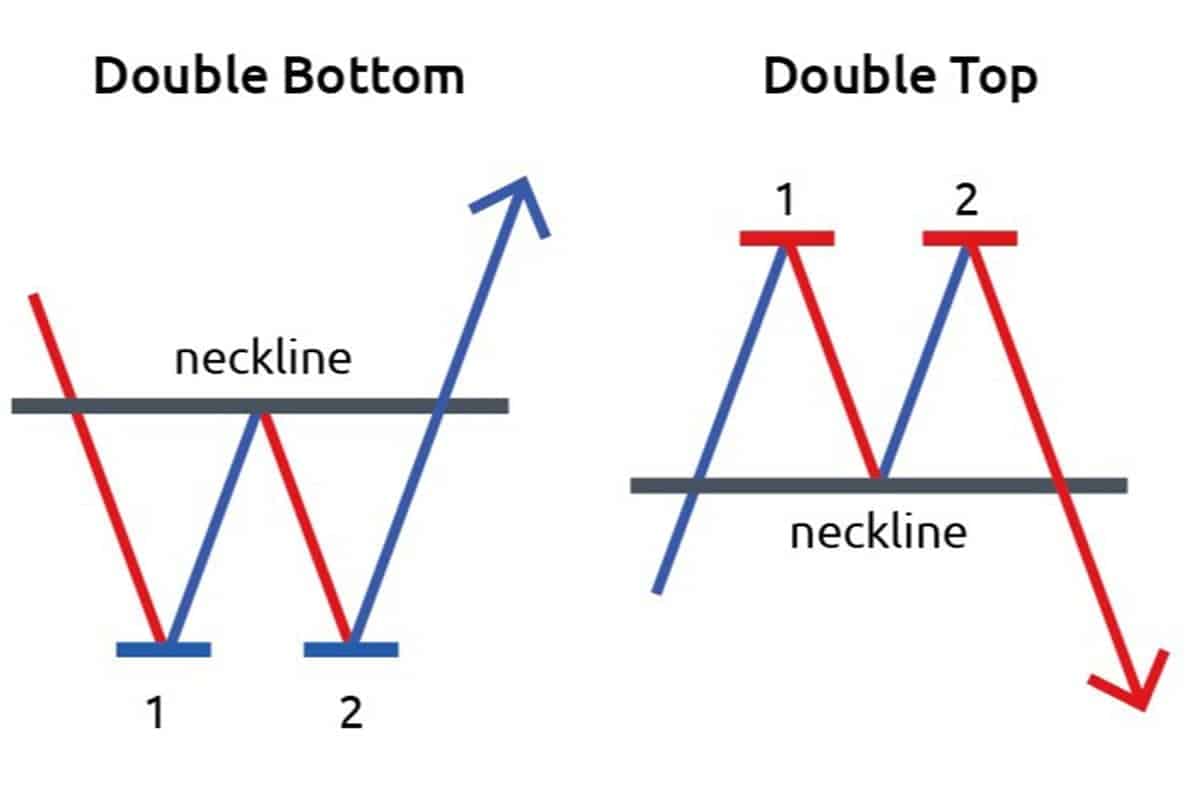
Double Top/Bottom: A reversal pattern with two consecutive highs/lows failing to break a resistance/support level, hinting at a potential trend change.
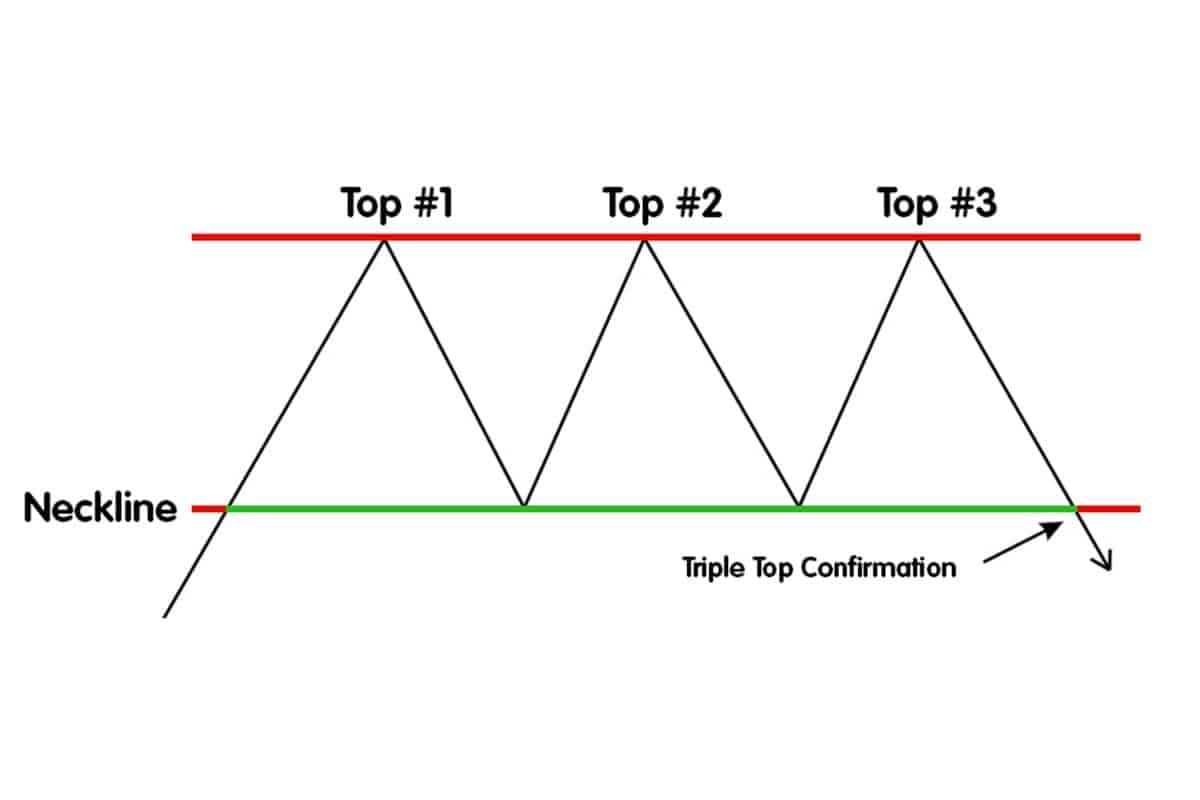
Triple Top/Bottom: Similar to the double pattern, but with three attempts to break resistance/support, suggesting a stronger reversal signal.
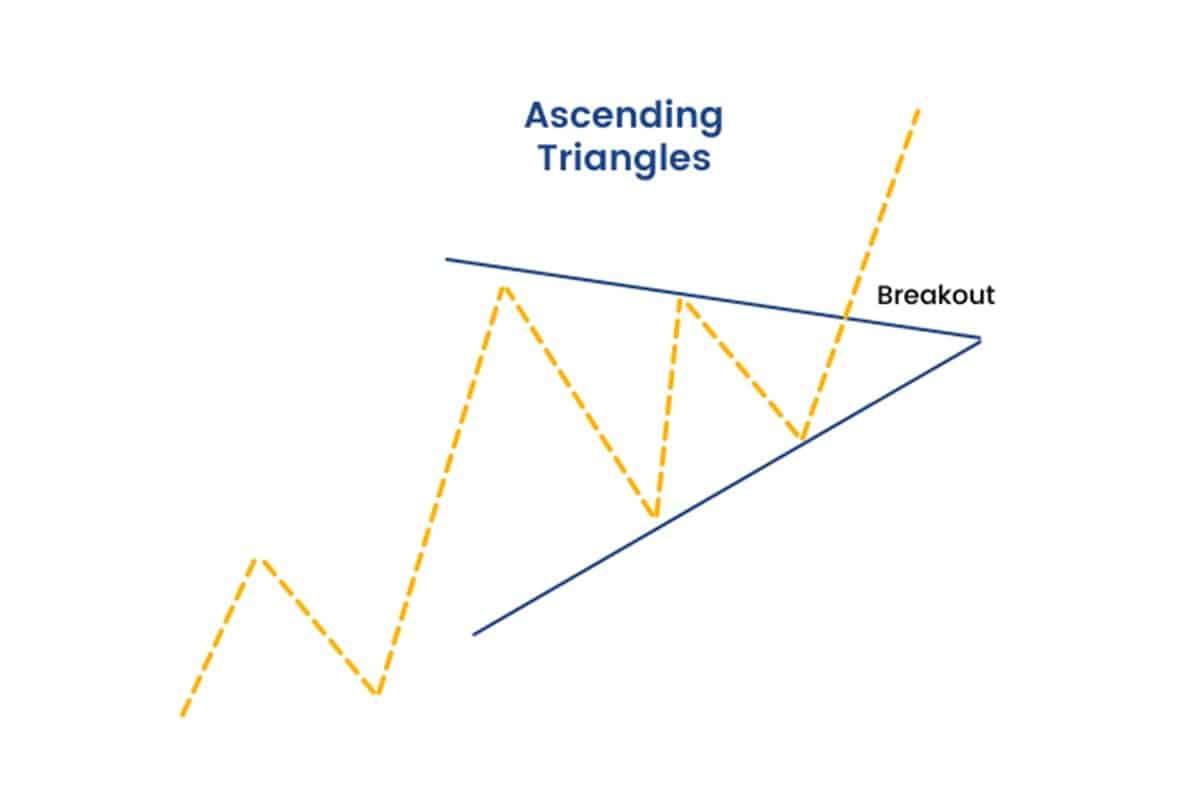
Ascending Triangle: A continuation pattern formed by rising trendlines connecting swing lows and horizontal lines connecting swing highs. A breakout above the triangle confirms the uptrend.
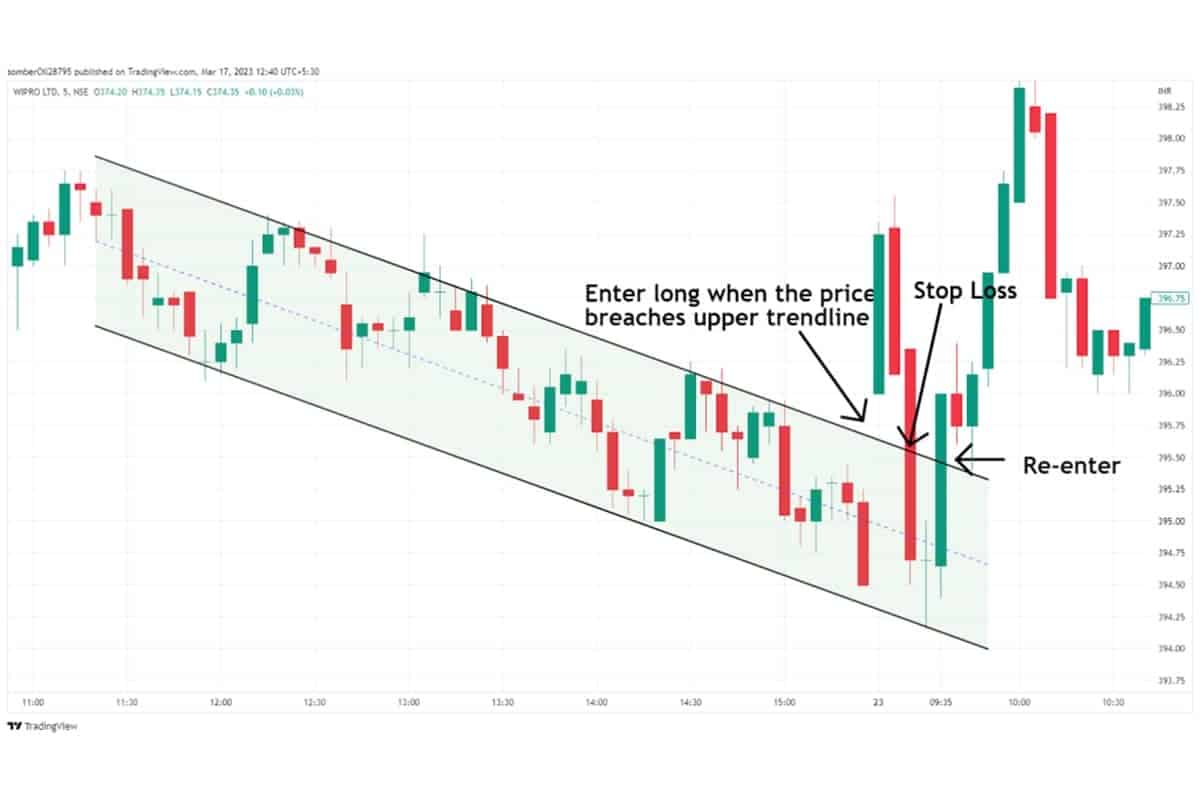
Up/Down Channel: Parallel trendlines connecting highs and lows, indicating a range-bound market. Breakouts above/below the channel signal potential trend changes.
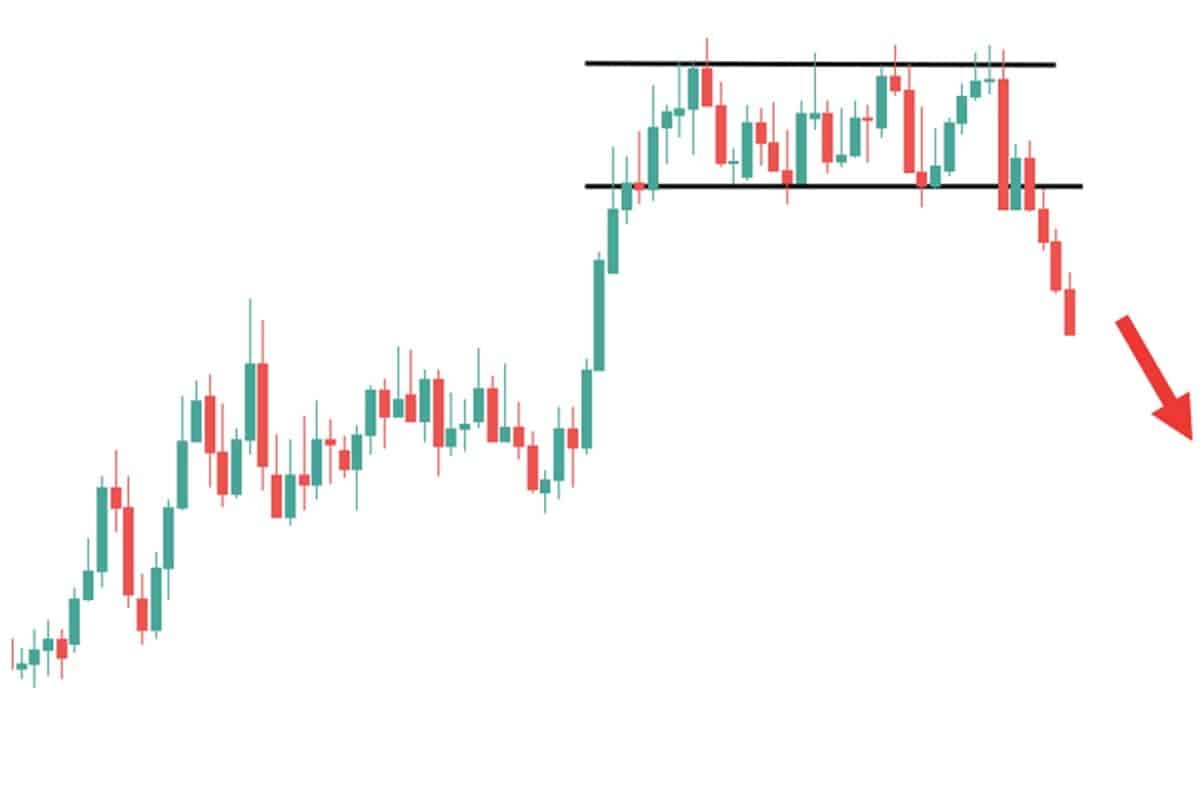
Rectangle Pattern: A consolidation phase within a horizontal range, offering potential breakout opportunities in either direction.
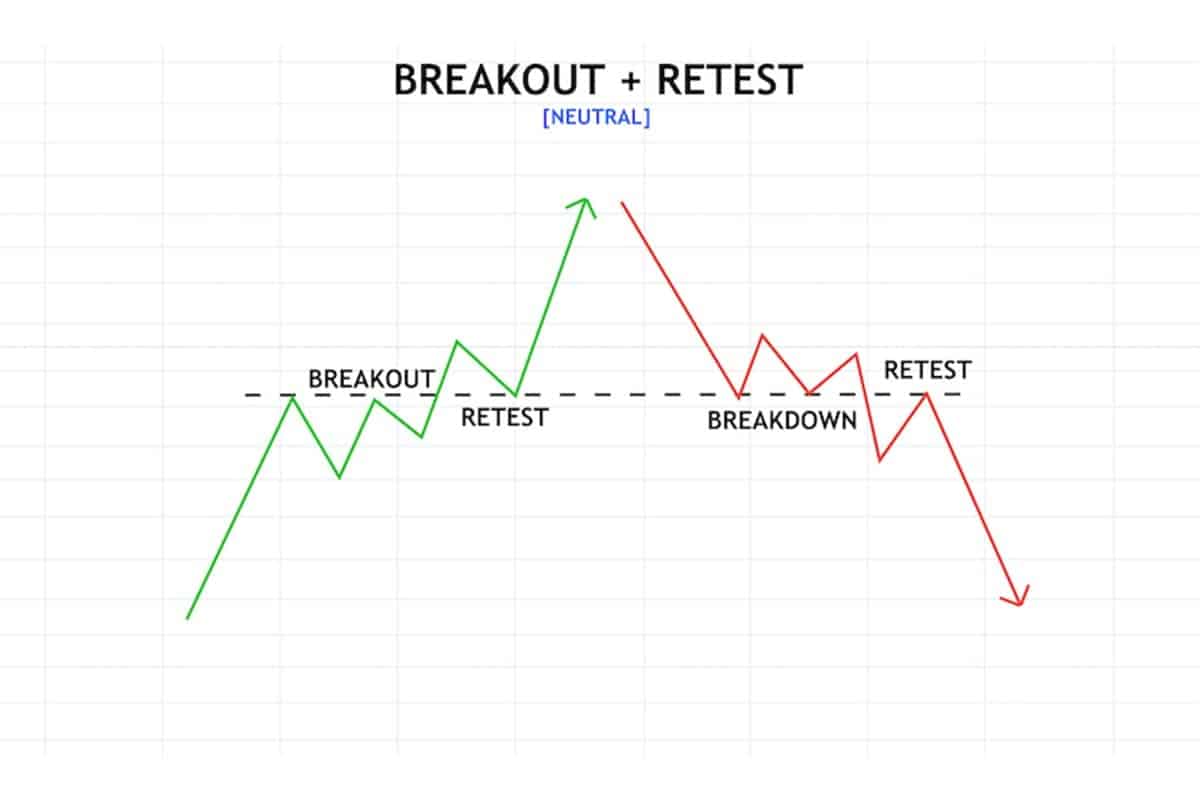
Breakout and Retest: A price breaks through a key support/resistance level, then retests it before continuing the breakout direction. A confirmed retest strengthens the breakout signal.
Why Crypto Charts Matter?
- Identify market trends: Recognize bull/bear markets, corrections, and rallies to make informed decisions.
- Manage risk: Use patterns to set entry/exit points and stop-loss orders, limiting potential losses.
- Gain market insights: Understand market psychology and how price movements evolve over time.
Remember: These patterns are tools, not guarantees. Combine them with fundamental analysis, risk management, and continuous learning for a well-rounded trading approach.
Also, in the comment section, you can freely share your comments and opinions about the topic. Additionally, don’t forget to follow us on Telegram, YouTube and Twitter for the latest news and updates.


