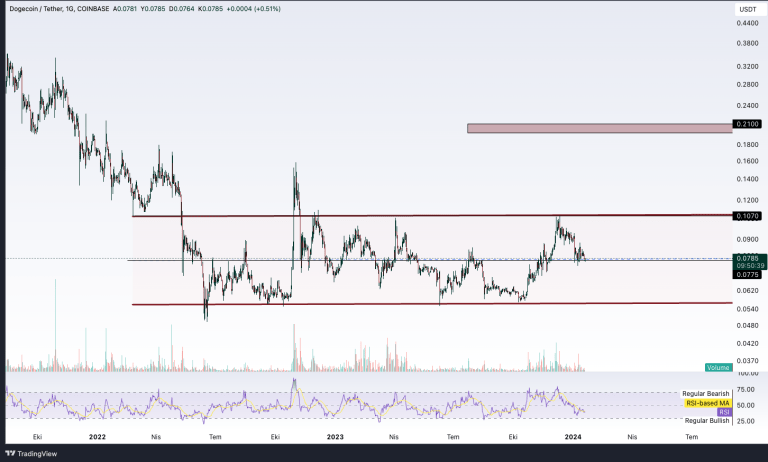
When we carefully look at the DogeCoin graph, we come across a horizontal channel formation. This formation tends to move the price of DogeCoin to higher levels at breaking points.
You might like: Grayscale CEO: Only 2 or 3 Bitcoin ETFs Will Survive!
Doge Coin is a prominent asset among popular MEME coins and when its price graph is examined, it is observed that it follows a horizontal movement for a certain period of time (600 days). This horizontal channel has a potential of 90% rise and fall.
At this point, it is important to understand which levels the horizontal channel in the price of DogeCoin is between and to evaluate how far it can continue within this channel. Passing the upper limit of the channel could allow DogeCoin to catch a new upward momentum.
In the horizontal channel, the price exceeding a certain level usually means breaking an important resistance and at this point, DogeCoin may have the potential to show a stronger rise. However, there will be important points and break levels that every investor should follow closely.
Dogecoin Analysis Chart

Dogecoin is preparing for the bull season with a horizontal channel formed between $10.70 and the dip level. Currently, we observe that the price is trying to hold on to the $0.775 support level, which is in the middle band of the channel. This situation indicates that the coin continues to gather strength.
In the coming days, if the negative atmosphere in the crypto market continues, the price of Dogecoin may be pulled to the lower support points with a downward movement from the middle band of the channel. You can participate in the live broadcasts on the Para Mühendisi YouTube channel to evaluate this situation more clearly.
However, in a positive scenario, MEME Coin has the potential to experience a sharp rise up to the target of $0.21 by first overcoming the middle band of the channel ($0.0775) and then the resistance level of $0.1070, which is the upper band of the channel.
Investors should closely monitor market movements during this process, evaluate technical analysis data, and effectively implement risk management strategies.


