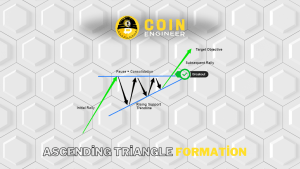
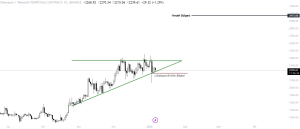
Upon examining the ETH chart, we observe the formation of a rising triangle, and typically, this structure seen in upward trends represents a continuation formation of the trend.

If our formation exhibits movement in line with expectations, a new upward trend may begin. There is a significant accumulation of liquidation at the top, but there is also a noteworthy accumulation of liquidation at the bottom, and without liquidating these positions, an upward movement may not occur. The accumulation of liquidation is in the region we marked below, and Ethereum (ETH) could clear this area with a swift move, much like a needle.

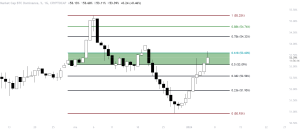
A second important detail is Bitcoin Dominance. The sharp increase observed in dominance indicates that a majority of significant funds are flowing into Bitcoin, and investors are more focused on Bitcoin. When examining the dominance chart, we can see that there was an increase up to around 53%. The current zone acts as an accumulation area and plays a resistance role. If Dominance reacts from this point and initiates a downward movement, it could increase the flow of money into altcoins and have positive impacts on Ethereum as well.
You may notice: Synthetix (SNX) Chart Review and Price Analysis!

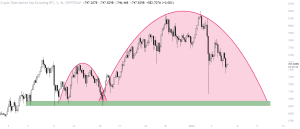
The third significant development is the inverse cup and handle formation that has emerged in the Total 2 chart structure. If this formation proves to be effective, we may witness a substantial loss of funds in altcoins, indicating that the declines could deepen further. In other words, the Total 2 chart currently appears to be quite negative.

Ethereum (ETH) Market Data
- Market Cap: $269,326,600,074 (0.09%)
- 24h Trading Volume: $8,710,840,324 (24.29%)
- Trading Volume / Market Cap (24h): 3.25%
- Circulating Supply: 120,184,491 ETH
- Total Supply: 120,184,491 ETH
- Fully Diluted Market Cap: $269,323,670,762


