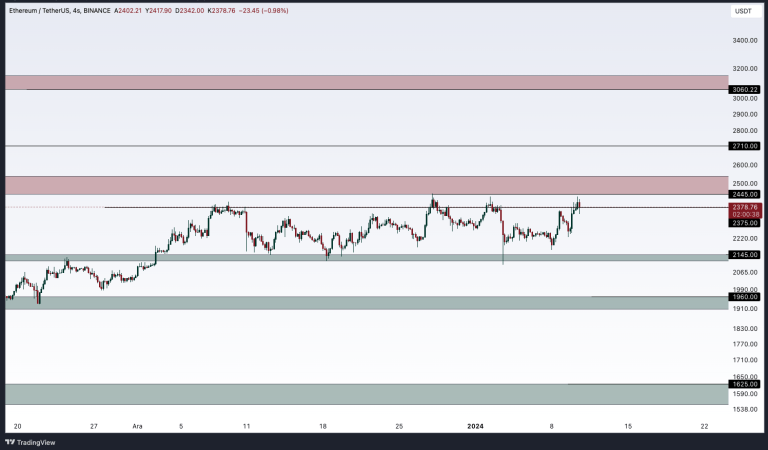
In this Ethereum price analysis, we will analyze past price movements through charts and technical indicators. We will identify support and resistance levels and provide guidance to investors on their buying and selling decisions.
You might like: Binance Announces Delisting of 9 Coin Pairs
Under the influence of recent developments, ETH has entered a strong uptrend. Despite the correction that occurred after Bitcoin ‘s rise, Ethereum seems to be exhibiting a rapid upward momentum. Investors who are selling Bitcoin for profit seem to be actively positioning themselves to buy Ethereum one by one.
However, Ethereum needs to overcome the resistances in front of it in order to show a more sustainable and solid rise. Now, let’s talk about the resistance levels that ETH may encounter when rising and the points where it may find support when falling.
The resistance levels that Ethereum may encounter can be as follows:

- USD 2,445 Level: If ETH reaches a higher level than its current price level, it may encounter resistance at this level.
- USD 2,710 Level: This level, which is determined as the next intermediate resistance point, could be another point where Ethereum may struggle to rise.
- USD 3,060 Level: If the ETF approval is received, it is likely that a sharp rise will begin in this case. In this case, an increase up to this level can be expected.
The support levels that Ethereum may find when falling can be as follows:
- USD 2,145 Level: If ETH comes to a lower level than its current price, it may find support below this level.
- USD 1,960 Level: This point, which is determined as a more solid support level, can provide significant support for Ethereum when it is in a downward trend.
- USD 1,625 Level: If a “sell the news” confirmation occurs after the ETF approval, ETH may fall to this region.
However, it is important for investors to be careful and to regularly follow market analysis, as price movements in the crypto markets are quite volatile.


