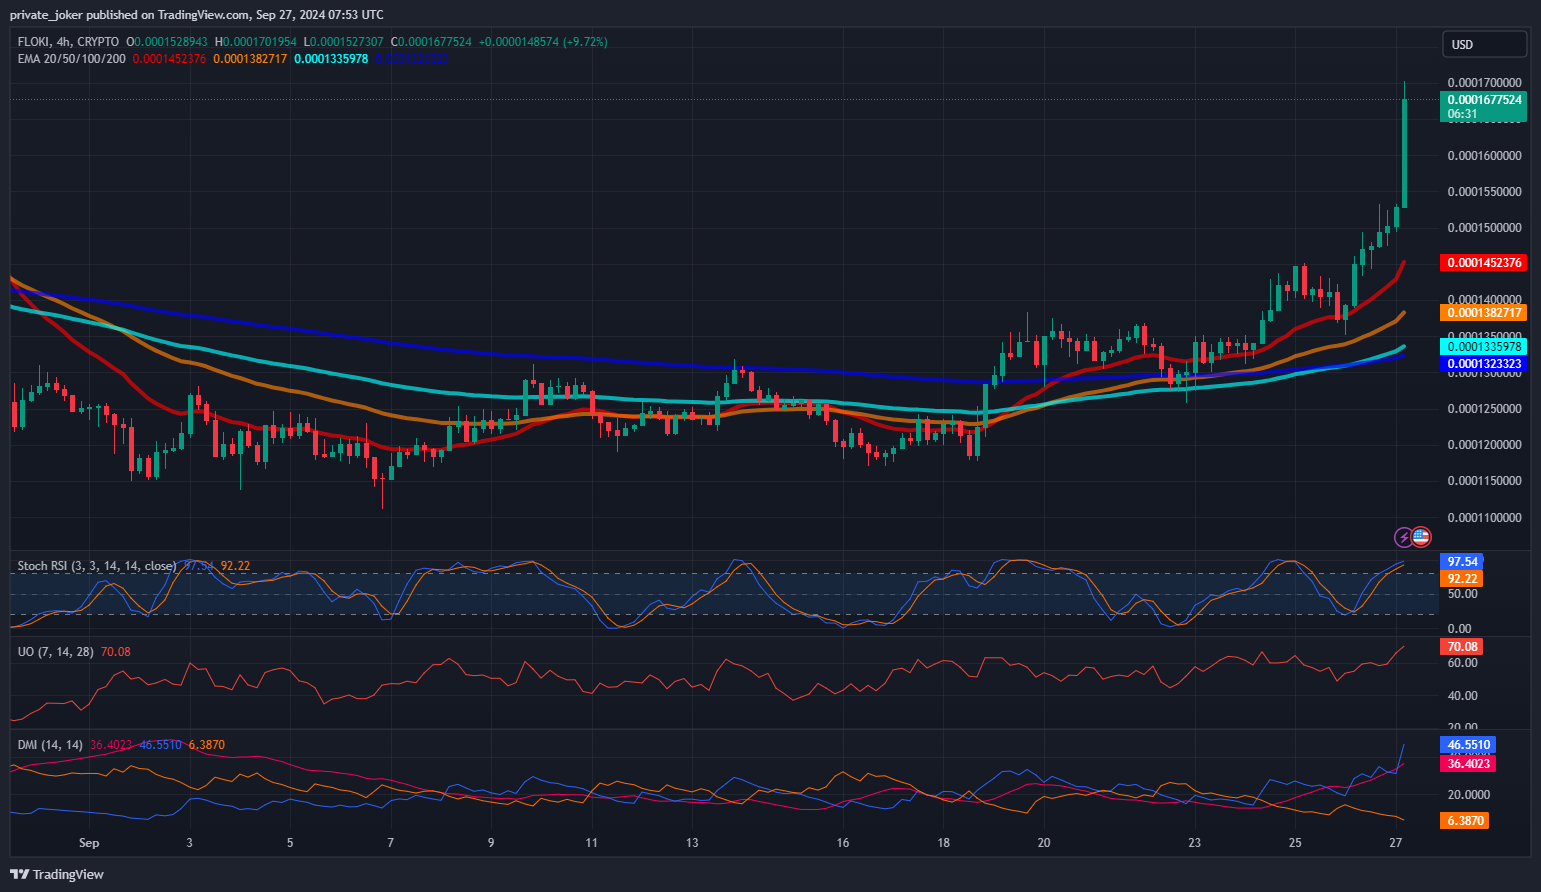
Over the past week, Floki Coin (FLOKI) has displayed notable market activity; technical indications indicate a strong buy recommendation. Rising market valuation and trading volume have made FLOKI a hot topic for investors trying to profit from the coin’s positive trend. This page explores FLOKI’s technical indicators, moving averages, and general market performance in order to present a whole picture of its present situation.
Technical Indicators: Neutral Overall
With one sell signal, seven neutral signals, and two buy signals, FLOKI’s oscillators show a more wary attitude and indicate a neutral rating generally. Key oscillators are broken out here:
- RSI (14): At 50.95, the Relative Strength Index (RSI) is neutral, suggesting that FLOKI is neither overbought nor oversold. This indicates a balanced market with potential for upward or downward movement.
- Stochastic Oscillator (9,6): With a value of 46.63, this indicator remains neutral, showing no significant momentum in either direction.
- MACD (12,26): The Moving Average Convergence Divergence (MACD) shows a sell signal at -0.0001227, signaling a slight bearish trend.
- Hights/Lows (14): This indicator provides a buy signal with a value of 0.01183, suggesting that the price may rise in the near future.
- Stochastic RSI (14): At 0.5350, this oscillator is showing a buy signal, indicating short-term bullish momentum for FLOKI.
Though the oscillators show a general neutral attitude, especially in the Stochastic RSI and Hights/Lows indicators, there are clues of bullish possibility.

Moving Averages: Strong Buy Sentiment
With twelve buy indications, two sell signals, and one neutral rating, the moving averages show a more hopeful picture, though:
- EMA (10), EMA (20), EMA (30), EMA (50), EMA (100), EMA (200): Across all timeframes, the exponential moving averages signal a buy, indicating that FLOKI is experiencing sustained upward momentum.
- SMA (10), SMA (20), SMA (50), SMA (100), SMA (200): Similarly, the simple moving averages show buy signals, further supporting the view that FLOKI’s price is expected to continue rising.
- SMA (30): The only sell signal comes from the 30-day simple moving average, suggesting that there may be a temporary resistance at this level.
Long-term investors find FLOKI appealing since overall the moving averages indicate that it is in a solid position to keep on its increasing trend.
Financial Performance: Strong Market Activity
Over the previous week, FLOKI has demonstrated notable financial expansion, raising market value as well as trading volume:
- Market Cap: FLOKI’s market capitalization has risen by 16.72%, now standing at $1.59 billion. This places it at #55 among cryptocurrencies, indicating growing interest and confidence in the token.
- 24-Hour Trading Volume: The 24-hour trading volume has surged by 123%, reaching $362.45 million. This sharp rise in volume signals strong market activity and liquidity, making FLOKI an attractive asset for traders.
- Volume-to-Market Cap Ratio: At 22.61%, the volume-to-market cap ratio shows that a significant portion of the market cap is being actively traded, further indicating strong liquidity.
You can also freely share your thoughts and comments about the topic in the comment section. Additionally, don’t forget to follow us on our Telegram, YouTube, and Twitter channels for the latest news and updates.


