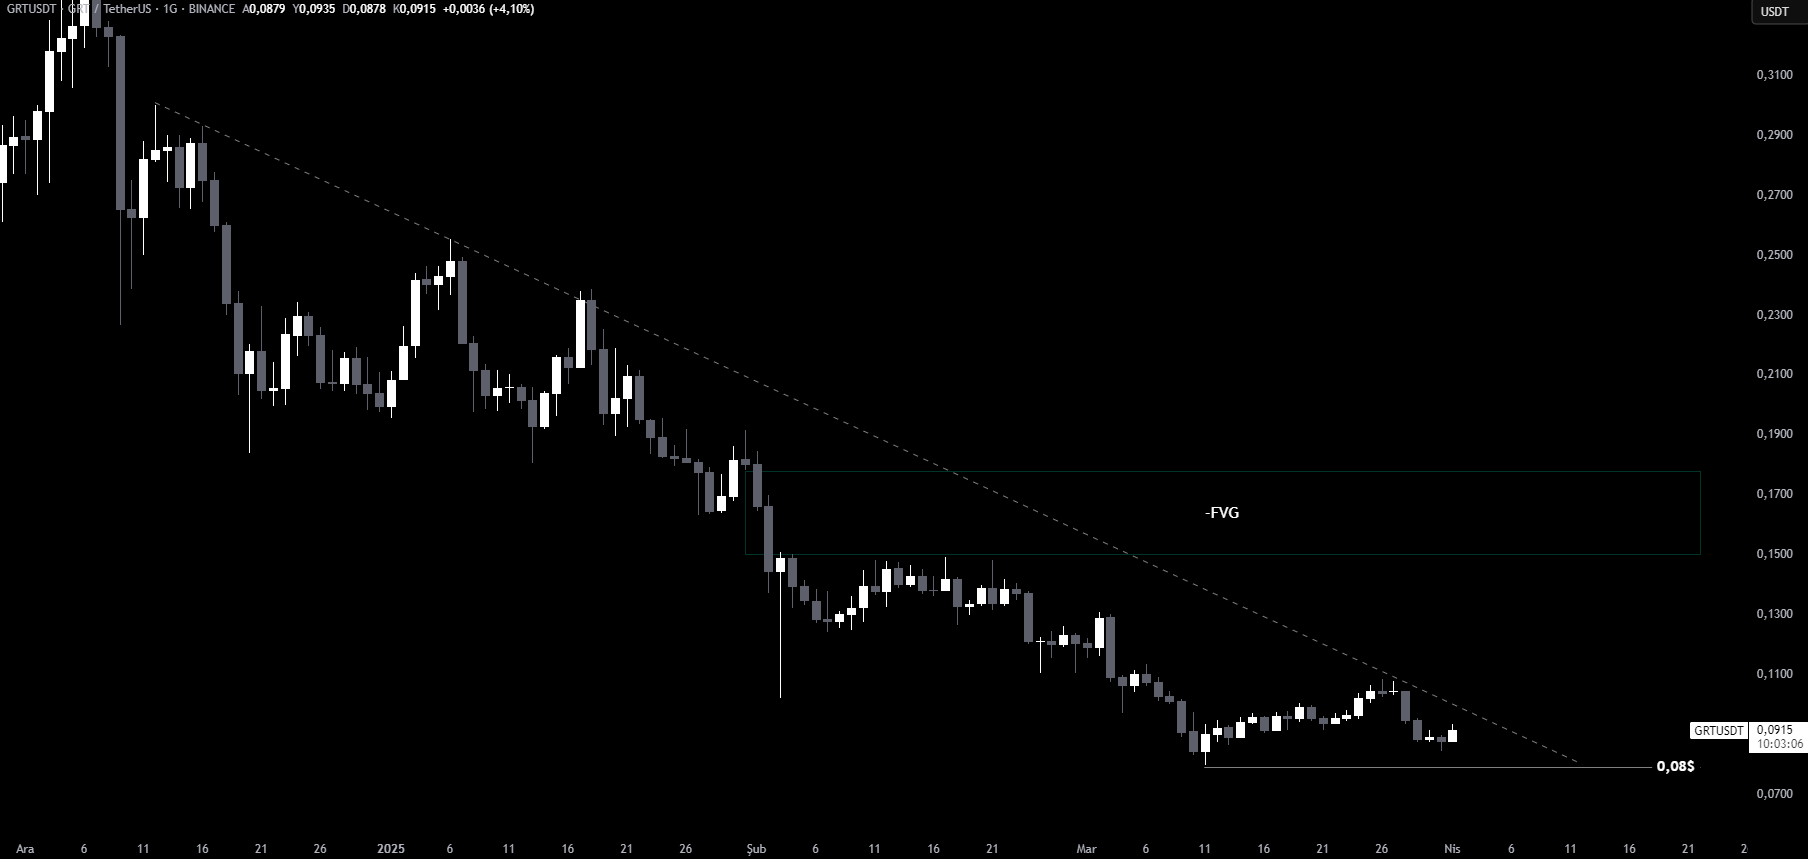
GRT is currently in a downtrend on the daily chart. The price action suggests a critical decision point.
Bullish Scenario:
- If GRT breaks the descending trend with strong volume, an upward move could begin.
- The first target would be the bearish FVG zone.
- Holding above this level could signal further gains.
You Might Be Interested In: Elon Musk Talks About the Name of a New Memecoin!
Bearish Scenario:
- If GRT gets rejected at trend resistance, selling pressure may increase.
- The nearest support level is $0.08.
- Losing this support could push the price down to $0.07.
Key Support and Resistance Levels:
- Main Support: $0.08 – $0.07
- Main Resistance: Descending trendline and FVG zone

High volatility is expected for GRT, making it crucial for traders to monitor key levels closely.
You can also freely share your thoughts and comments about the topic in the comment section. Additionally, don’t forget to follow us on our Telegram, YouTube, and Twitter channels for the latest news and updates.


