Trading View is one the best platforms that everybody can use to it for their own fundamental and technical analysis. Besides, the platform is optimal for traditional and centralized financial markets.
The blog will answer some questions: What is a Trading View that has more than 50 million users and is commonly used for technical analysis of the crypto market, funds, currencies, etc. in the world?
You might also like: How To Use Binance Mobile Application? Detailed Usage
What Is Trading View?
Trading View is a graphic platform with a “Look first, then leap ” philosophy. The platform believes in the philosophy for to develop life incomes.
Trading View presents real-time price performance for forex, stocks, crypto, and other financial markets. Most trader and investor uses Trading View because of these features, and simple background. These days, Trading View is the leader in its market.
Firstly, Trading View was put on the market in the 2011 year. The platform has reached more than 50 million users just after 8 years. Users can apply for free and premium accounts and can use them for technical analysis. But there are some limited services in the free account.
Ultimately, users can share their knowledge via Trading View Community. The feature grants an opening for improving their wisdom about the topics.
How To Use It?
If you see for the first time Trading View, that may be confusing for you. But don’t be afraid of that. Because we will help you with that as Coin Engineers.
Later on, we must step together for learning the platform. First of all, you see Bitcoin/USD parity in the picture belove.
Section 1: Top Toolbar
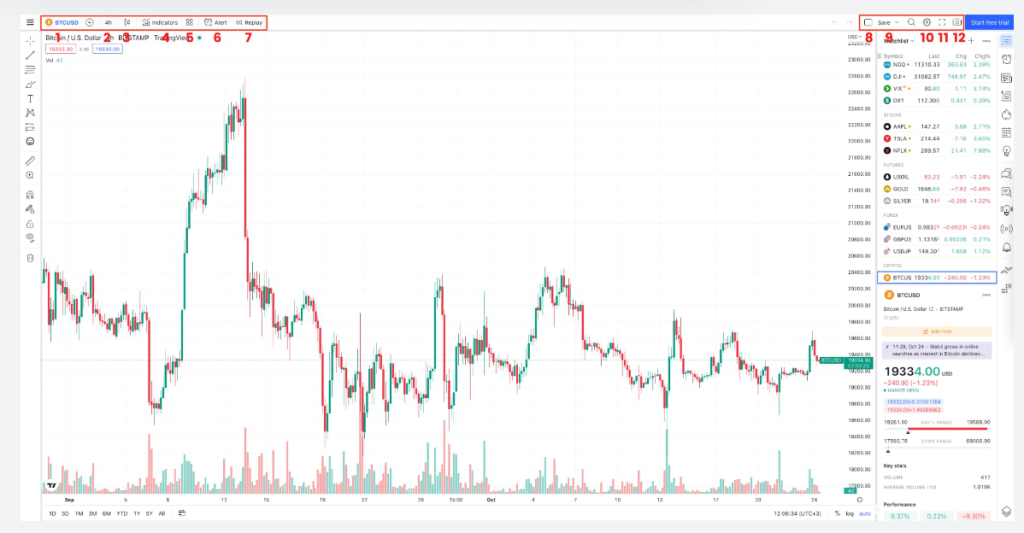
The menu contains trading parity, time frames, indicators, templates, and other tools.
- That’s a trading parity (BTCUSD). You can change, add and compound another parity using the tool.
- Time Frames (TF) are located there. The Trading View gives an opportunity for using from frame for 1 second to 1 Month. Time frames from 1 second to 1 minute include the premium account’s feature. Additionally, you can choose your own favorite TF by clicking the “star” button.
- Users can select types such as candles or sticks (lines). In the stick mode, you can’t see the wicks in the candles.
- It’s possible to choose some indicators using the 4. sections. In the section is located RSI, MACD, Bollinger Bands, etc.
- This section holds some special designs using indicators.
- 6. section was used to set some alarms for relevant price areas. If you have no time for looking at computer screens, the section will help you.
- This section is the “Replay” feature. You can do backtest thanks to the feature. If you have a free account, you just do backtest in Daily, Weekly, and Monthly time frames. But if you want to do backtest in the lower than the time frames you must have a premium or pro account.
- The feature is also. Only premium or pro account owners can use it. If you want to follow a lot of charts at the same time, the section can help you.
- You can save your own charts, at the end of work.
You can make private graphics using the button (10), and the key(11) does fullscreen any graphic or chart. (12) The button presents a possibility for the coping chart’s link.
Section 2: Left Toolbar
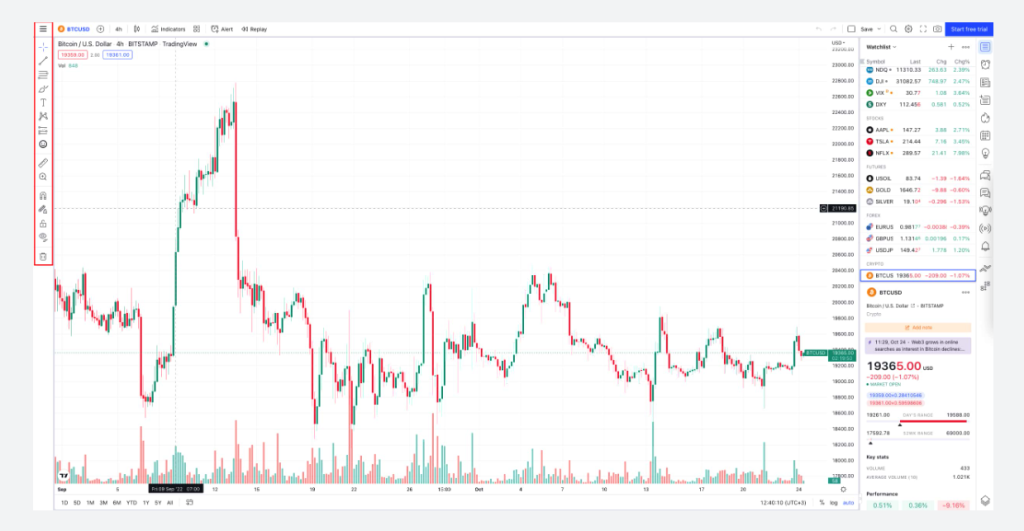
Especially, the toolbar is most useful in the platform. Because Trading View is users are traders. The left toolbar contains some technical analysis tools.
There are in the toolbar: Fibonacci Tools (Retracement, Channels, Circles, etc.), Brush, Trend Lines, Horizontal Line, Long/Short Positions, Geographical Shapes, Text box, Ellior Waves Tools, etc.
Section 3: Main Menu
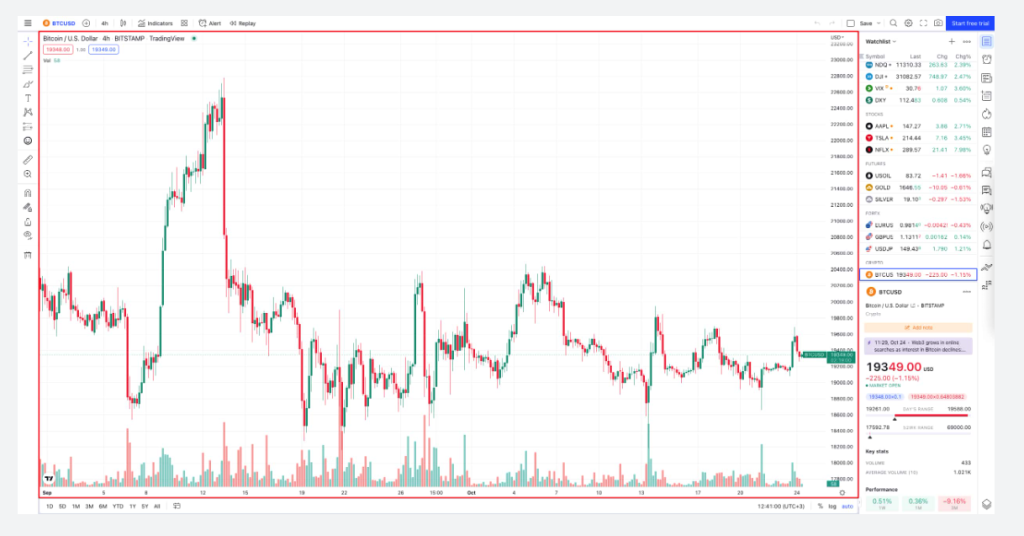
The main menu is the most important area in the Trading View. Because users spend a lot of time analyzing in there. You can see the movement in the price thanks to the area. Indicators, tools, and other things are shown in there.
Section 4: Right Menu
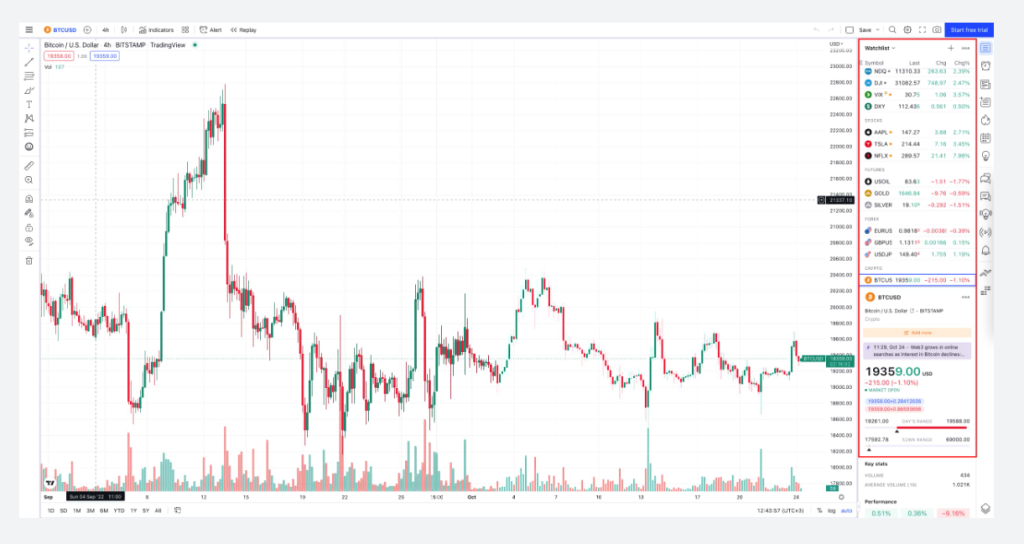
The menu includes some social features. You can observe parities, follow lists, alarms, news, community, gainers&losers, orderbook, and object tree.
In the bottom of the panel, you can see the buying and selling power of the price. And then there is a financial statistics about the parity and price movement changes. Furthermore, if you can add another parity, you can click the “+” button.
Step 5: Bottom Menu
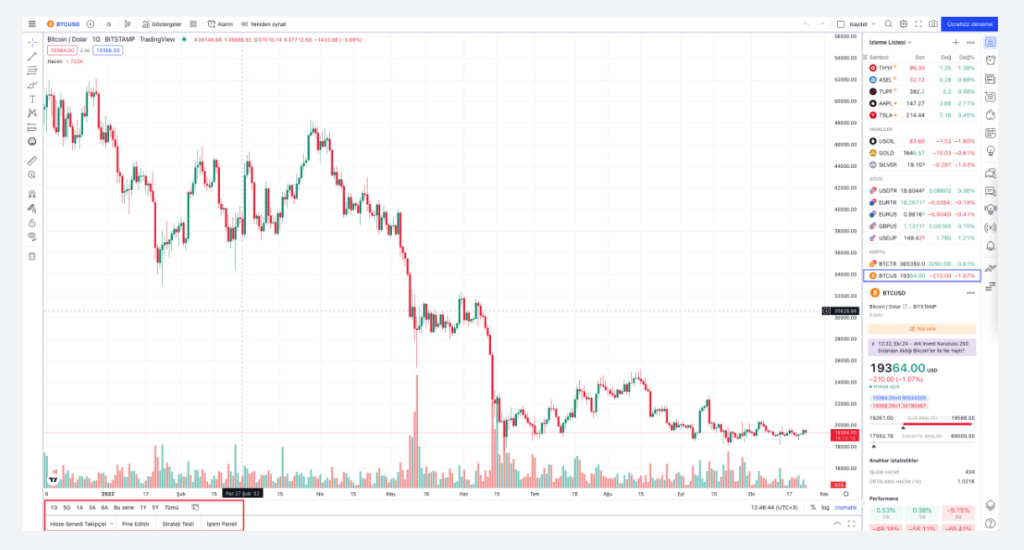
Usually, users use the menu for strategy testing and development, and crypto/stock screener. On the screener side, you can find some activities according to your own strategy. There are indicators and financial metrics. Additionally, you can add some brokers.
You can present your own thoughts as comments about the topic. Moreover, you can follow us on Telegram, Twitter, and YouTube channels for the kind of news.


