Bitcoin continues its upward trend, and we will analyze past price movements through charts and technical indicators. We will identify support and resistance levels and provide guidance to investors regarding buying and selling decisions.
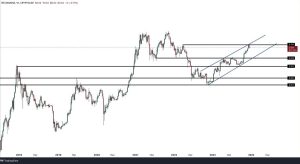
Hello friends! Recently, I have shared the analyses I have conducted on various Bitcoin charts. Today, however, I would like to focus on a completely different perspective via the Bitcoin/WM2NS pair. This pair represents the graph of the Bitcoin price divided by the USA ‘s M2 Money Stock, i.e., the amount of dollars circulating in the market.

When we look at our graph, firstly, I want to say a few things about the bottom level. If we base on the BTC/USDT chart, we know that the bottom is actually $15,500. However, when we examine it with the M2 data, we can say that we have actually dropped to $11,500 levels. This disparity is directly related to the number of dollars that the USA has printed in the recent years. Considering this conjuncture, it brings us closer to the actual price and we believe this was the most critical factor that misled those claiming the Bitcoin would hit $10,000 – $11,000 for months.
You might like: Judge Approves Agreement Between Binance and CFTC!
Now, when we look at the present day, we see that the Bitcoin/USDT chart shows the peak at $44,500. But we think the biggest detail they might have missed could be this. Since, when we examine the Bitcoin/WM2NS graph, we are already at the $48,250 level. Considering this graph, we can say that there is a rising channel formation and that it has reached the upper band of this channel. We can suggest that the correction to start from here can average down to the $34,000 level.
Even though this possibility has a low probability, we think it’s important to mention it. If the rising channel structure breaks downwards, there may be a possibility that Bitcoin will fall as far as $22,000. However, we must not forget that a news that supports the technical analysis needs to be circulated in the market for this to happen.
In the comment section, you can freely share your comments and opinions about the topic. Additionally, don’ t forget to follow us on Telegram, YouTube, and Twitter for the latest news and updates.


