Bitcoin BTC price analysis, we will analyze past price movements through charts and technical indicators. We will determine support and resistance levels and provide guidance to investors about buying and selling decisions guidance.
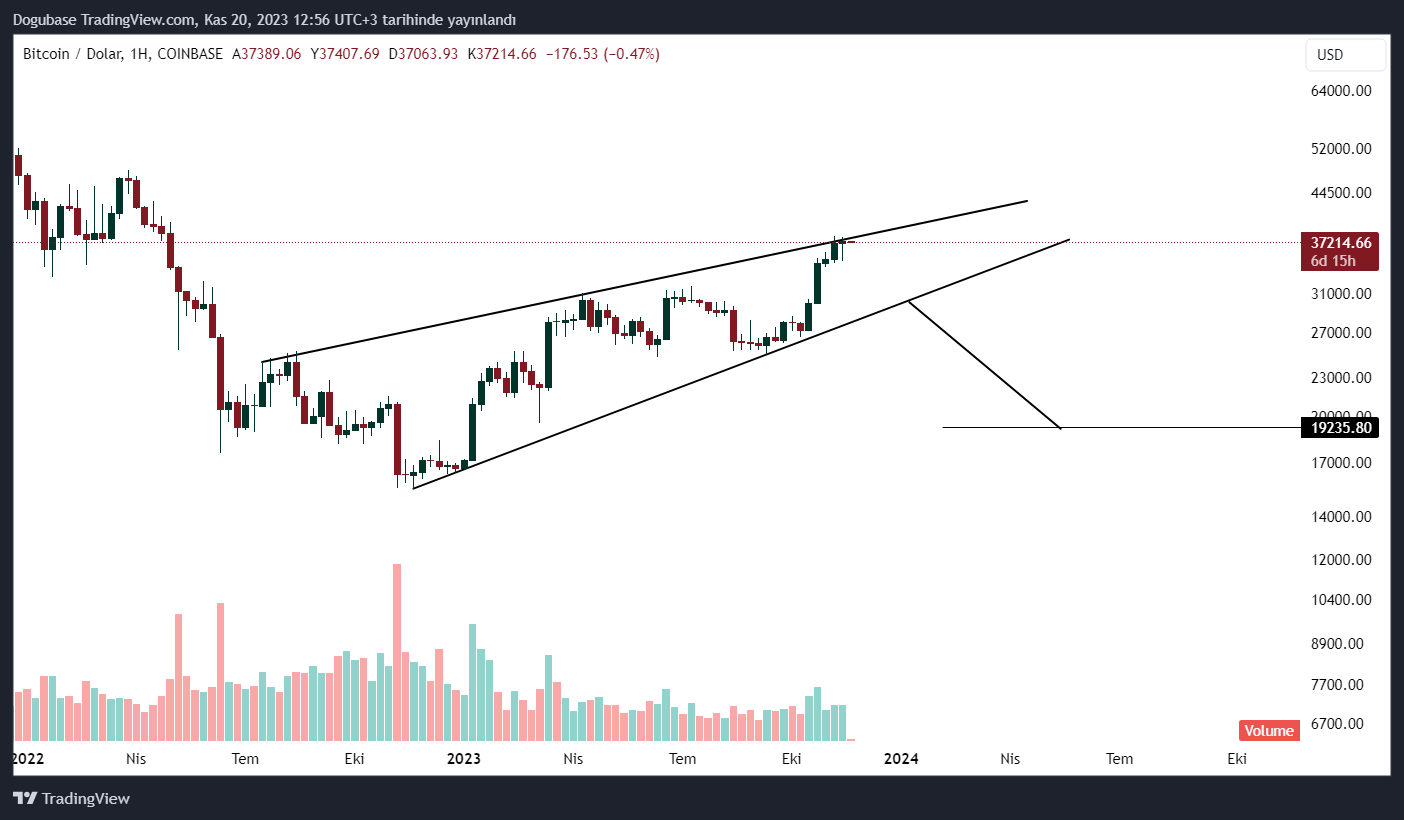
When we evaluate the Bitcoin chart in general, we observe that it is in a rising trend for 363 days after making a bottom of around 15,500 dollars. During this time, we observed that the decreases in trend changes were generally between %20 and %22.
In rising trends, we saw a potential rise between %50 and %60, but we could not establish a full connection between these rising trends. In falling trends, on the other hand, we can say that this rate usually varies between %20 and %22. Now, let’s examine the rising wedge formation formed after these decreases and increases in more detail.
Bitcoin’s Rising Wedge Formation

When we examine the rising wedge formation in Bitcoin in detail, we observe that this formation has a strong trend line because three touches were made to the upper band of the wedge. We believe that the presence of three touches on the lower band of the wedge enhances the possibility of the rising wedge formation working.
In terms of upcoming developments, we observe that the level of 37,850 dollars in Bitcoin is the top of the wedge. If Bitcoin does not close this week above this region, we can observe a decline to the lower band of the wedge. Let’s remember that the drops in the transformation trends we mentioned earlier were generally between %20 and %22. If there is a fall in Bitcoin, we can expect a pullback to 29,000 dollar levels with a %22 drop. Also, assuming that possible bad news can also affect the market, we can see a decrease to 19,235 dollar levels in the event of a downward breakthrough in the wedge.
This analysis is entirely based on technical analysis and it is important to remember that technical analysis isn’t 100% accurate and when evaluated with upcoming news flows, it will have a higher accuracy rate.


