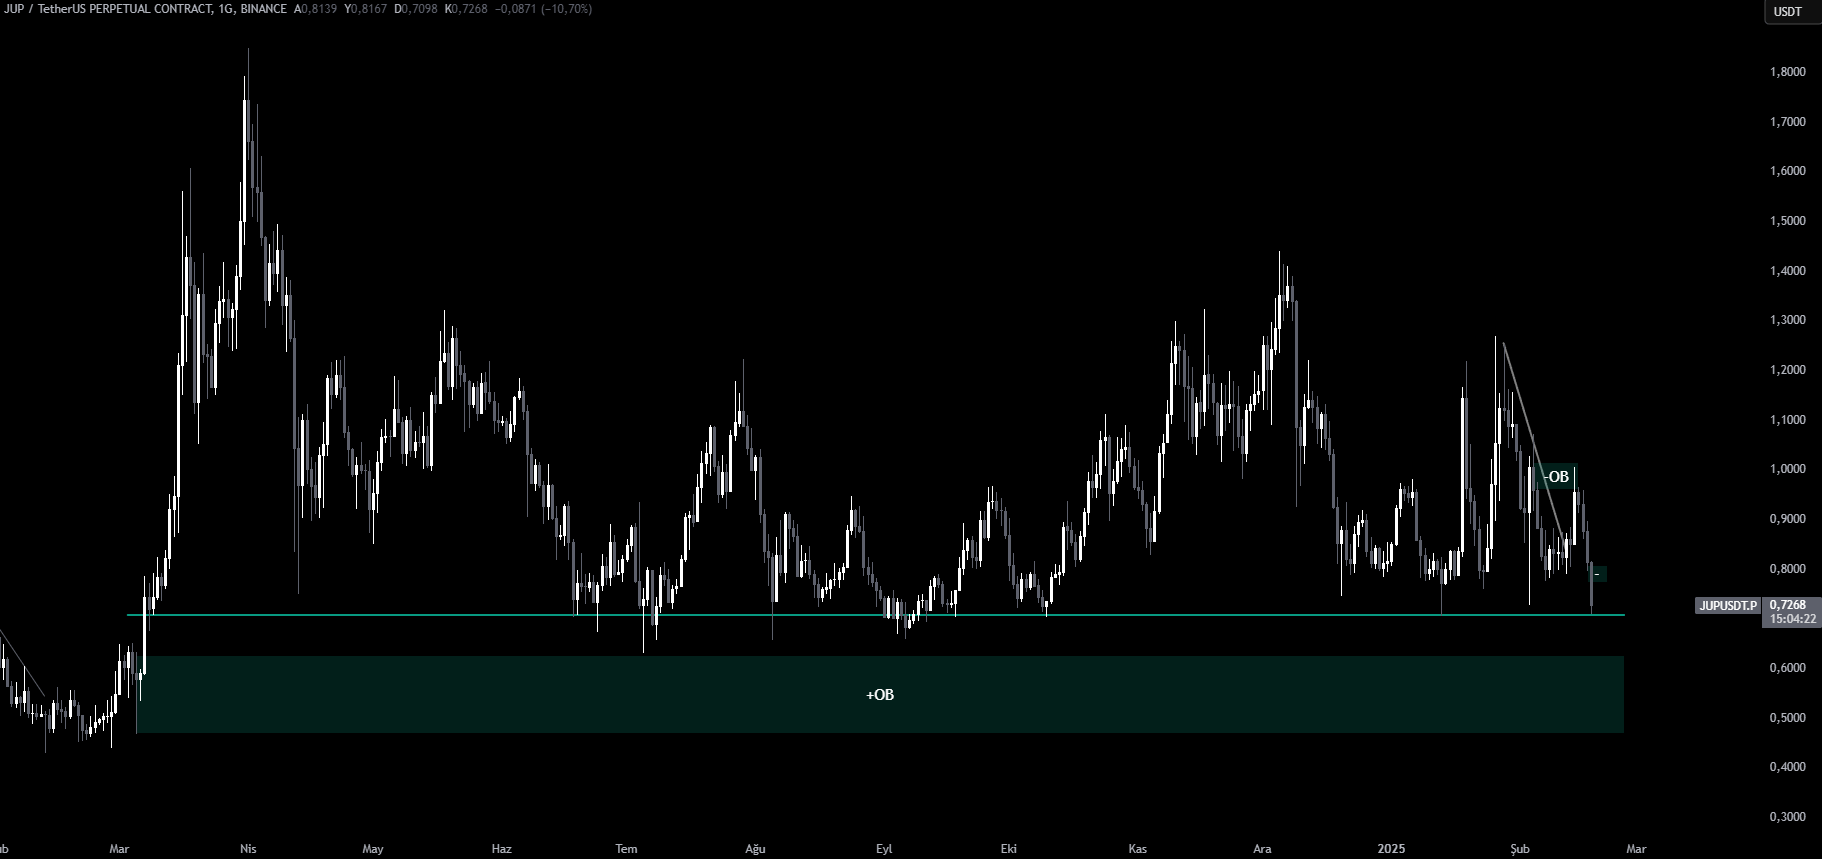
Jupiter (JUP) continues to test significant technical levels. On the daily chart, if the price drops below the 0.7076 USD level, the 0.63 – 0.65 USD support range becomes highly crucial. This area hosts an unused order block, which indicates that it could provide strong support. A pullback to this region could potentially present a buying opportunity.
Jupiter’s Decline and Key Support Levels
Jupiter has made its way down to important price zones. In the daily chart analysis, if the price breaks below 0.7076 USD, the 0.63 – 0.65 USD range will become an important support zone. This area includes an unused order block, suggesting strong buying interest could emerge if the price reaches this level.
You Might Be Interested In: Elon Musk Talks About the Name of a New Memecoin!
Moreover, previous price actions and trading volumes have made this area a significant price region. If tested, it could trigger strong buying pressure, and the price might bounce back. However, if the price falls below this support, further selling pressure may follow.

What’s Happening on the 4-Hour Chart?
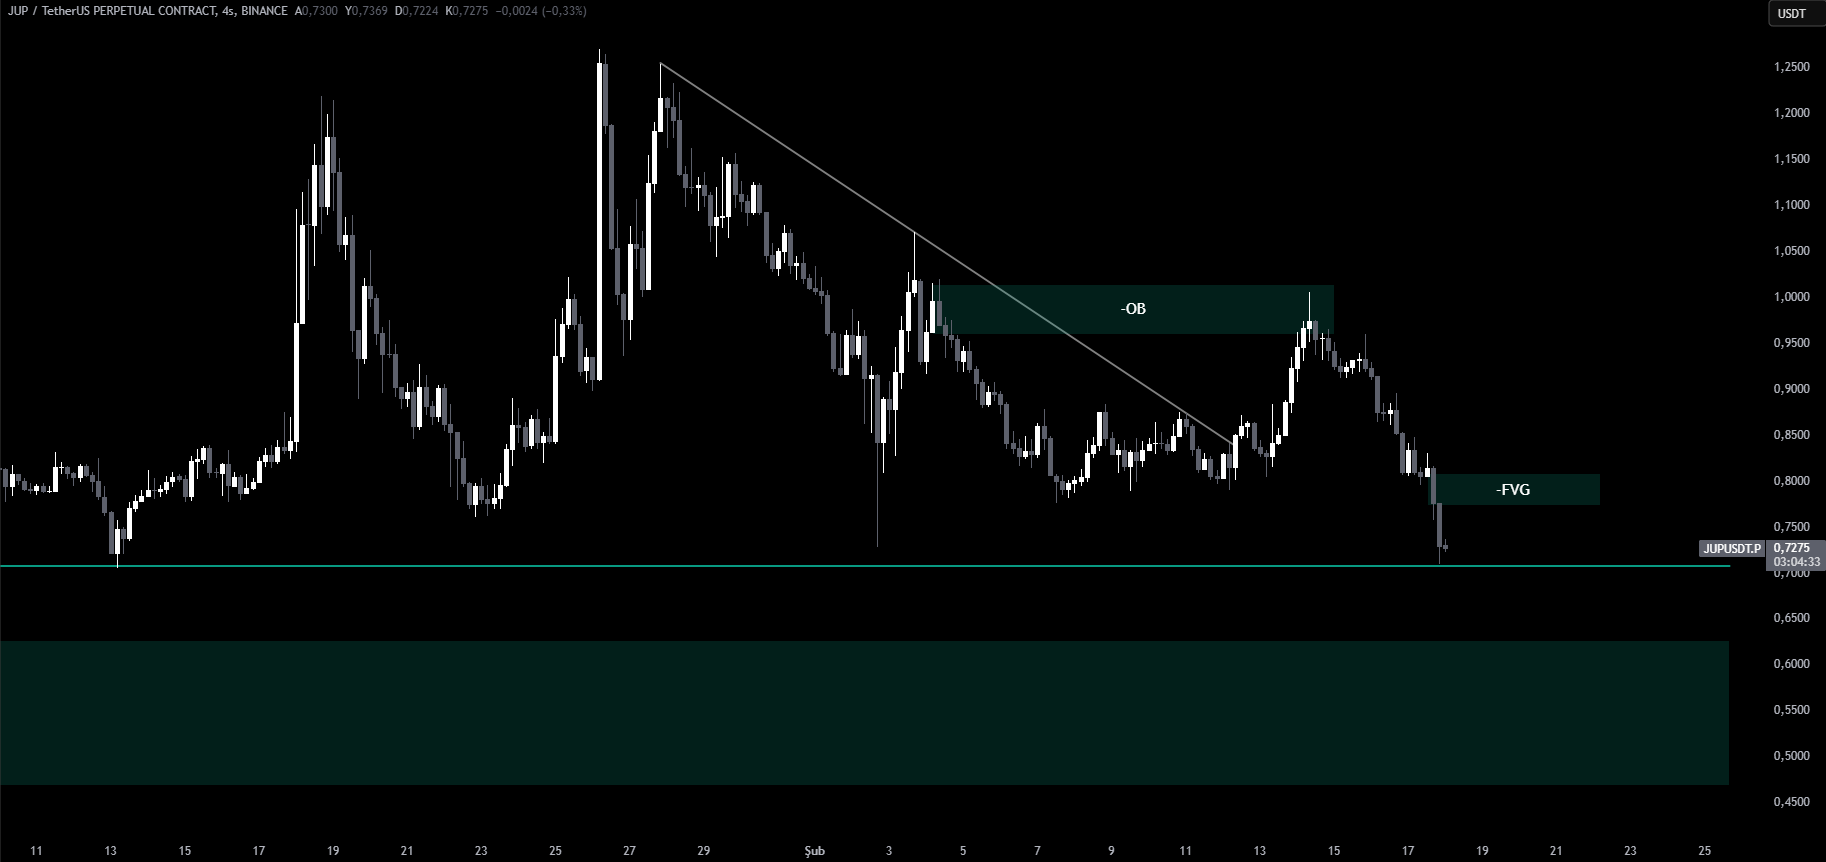
On the 4-hour chart, Jupiter has broken its previous downtrend, attempted a rally but has pulled back to the current support after testing a downward order block level. This indicates that Jupiter is facing a struggle to hold the current levels. The downward FVG (Fair Value Gap) region can serve as a potential resistance level to monitor. Traders may be waiting for a reversal signal at this level.
If the FVG region is broken, the upward movement might strengthen, pushing the price to test higher untested resistance levels. However, the crucial point to watch here is whether buyers will step in. If they do, the price could stabilize and move higher.

You can also freely share your thoughts and comments about the topic in the comment section. Additionally, don’t forget to follow us on our Telegram, YouTube, and Twitter channels for the latest news and updates.


