LINK Technical Analysis Upgrading Staking Mechanism! The decentralized data processing protocol Chainlink has introduced Chainlink Staking v0.2 to the market, upgrading its local staking mechanism with an expanded pool size of 45 million. With this upgrade, where can the LINK price go? Here is the LINK technical analysis for you.
LINK Technical Analysis:

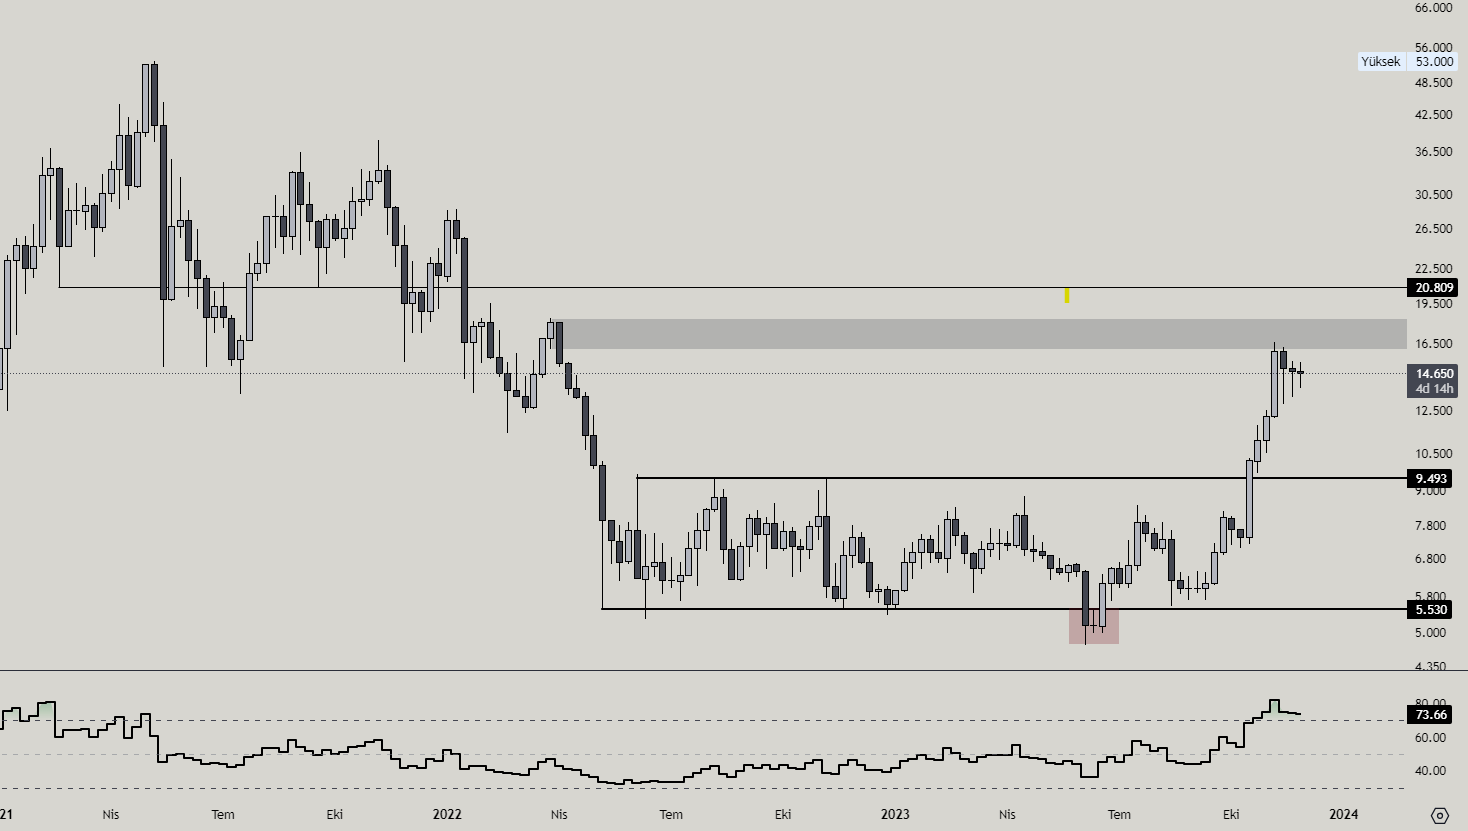
When we examine the weekly chart, $LINK, which has been moving in a channel in a price range of approximately 75% from May last year to October 21, managed to reach the $16.6 level by showing a rise of approximately 75% as much as the channel width, breaking up the channel it was in with the rise of Bitcoin in October. Later, it experienced a correction by reacting from the order block level of $16.16 – $18.32 on the weekly chart.

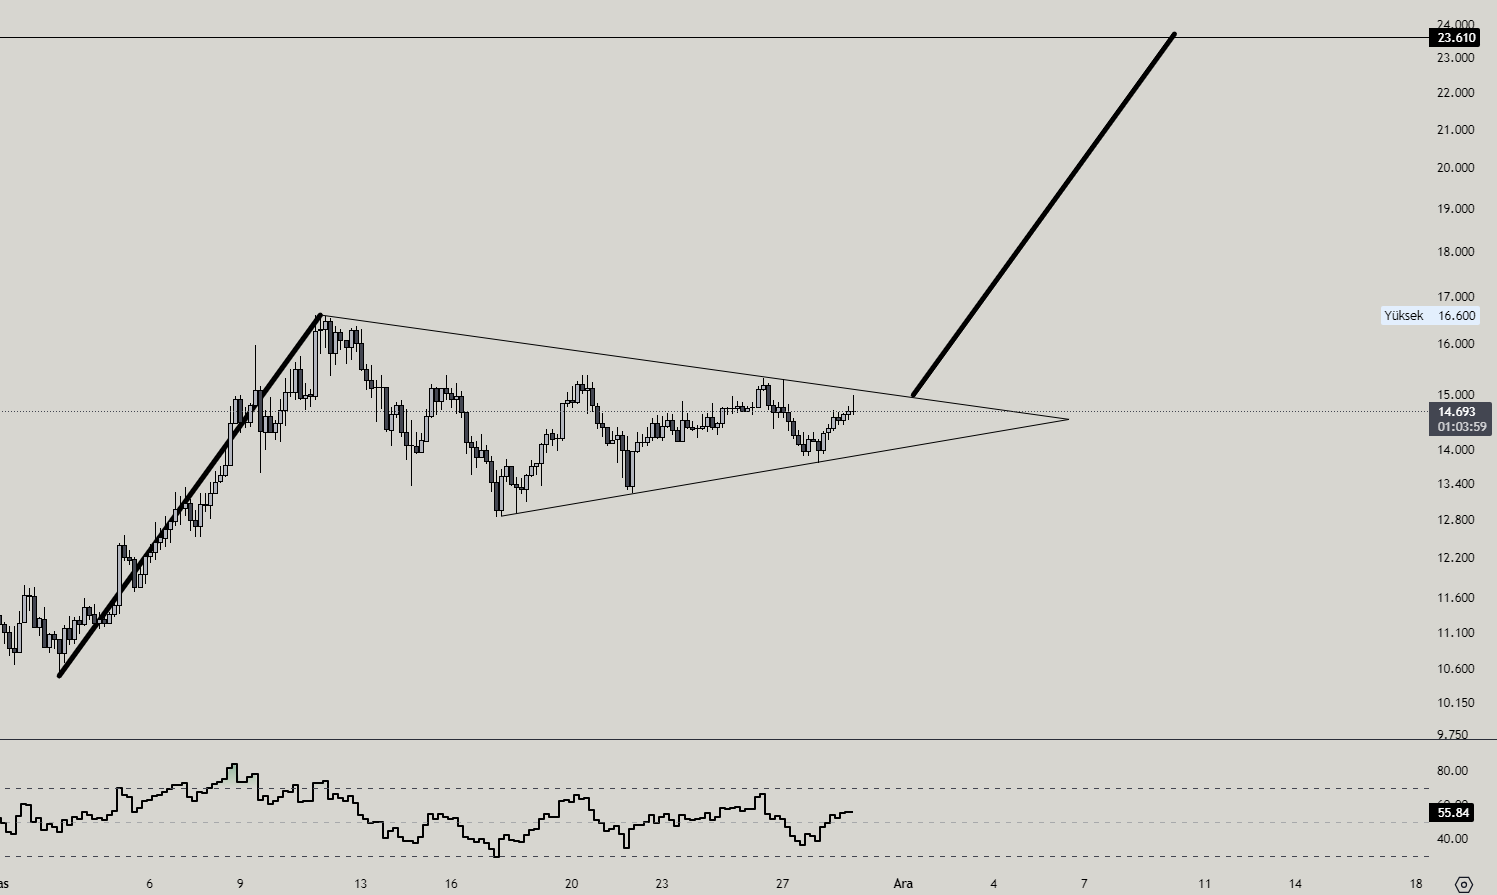
When we come to a shorter time frame, we can see a possible triangle formation on the 4-hour chart. As long as the price does not break the downtrend line, it can be said that it is positive. If Bitcoin keeps climbing and the price manages to break up this structure, it could target $23.6 in the long term.
LINK Market Data
- Circulating SUPPLY: 556,849,970 LINK
- Total SUPPLY: 1,000,000,000 LINK
- Maximum SUPPLY: 1,000,000,000 LINK
Where to Buy LINK?
Link; is traded on many exchanges such as Binance, OKX, BitMEX, Bybit, Bitget. You can click HERE to reach referral links to register for exchanges at a discount.
To stay informed instantly about our content, you can click HERE to follow us on Google News!


