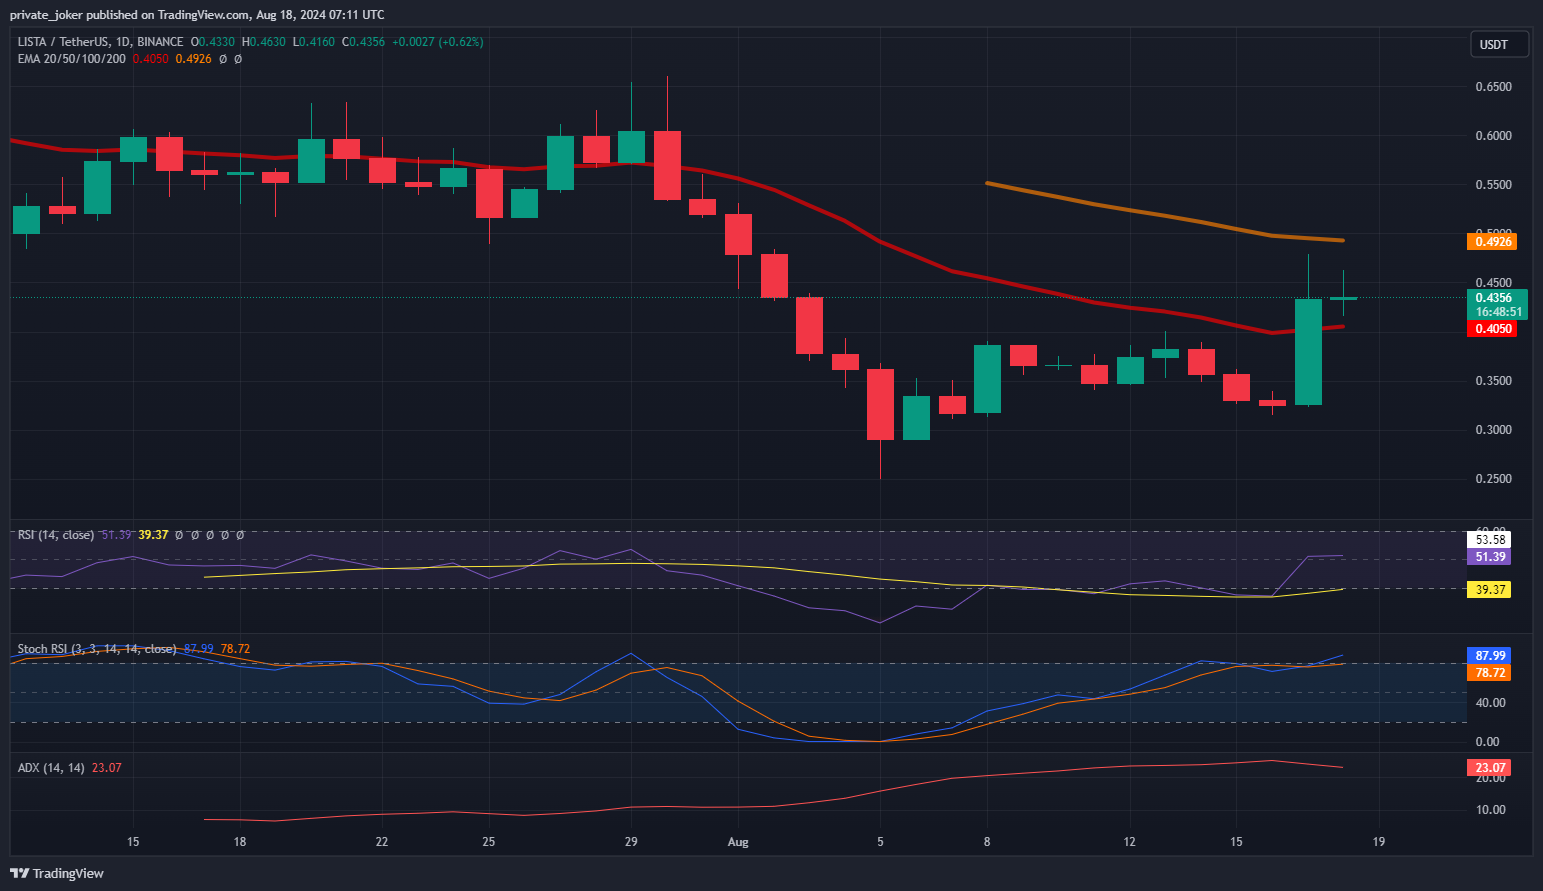
Support and Resistance Levels
For Lista DAO (LISTA) token, which has a current price of $0.4353, the support level of $0.3317 seems quite strong. This level can function as a basis that generates investor purchasing possibilities. Still, should this support fail, it is not impossible for the price to drop to lower levels. Conversely, the opposition at the $0.4666 level creates a barrier restricting LISTA’s upward mobility. Dealing with this opposition could let the token pass to higher degrees.
All Time Highs and Lows
Following an all-time high of $0.8428, LISTA underwent a dramatic drop. Though present pricing levels still considerably below this peak, the fact that it is far from the all-time low of $0.2517 indicates that the market is in a certain recovery trend.
Market Capitalisation and Trading Volume
With Lista DAO’s market capitalization at $104,861,824, the cryptocurrency has clearly established some presence in the market. Still, the last 24 hours’ trading volume came out to be $183,427,486. This volume shows a remarkable rise of 680.60% over the day before. Such a significant rise suggests strong market volatility and shows that investors’ LISTA interest has grown.

Oscillators
In technical assessments, oscillators are often used to determine whether an asset is in overbought or oversold zones. Here, the oscillators give a ‘Buy’ signal, which indicates an overall positive market outlook.
- RSI (14): At 50.91, it is at a neutral level. This indicates that the asset is neither in overbought nor oversold territory, and the current price action is balanced.
- STOCH (9.6): At 83.89, it is neutral. This suggests that the stochastic indicator is close to the overbought zone, but not there yet.
- STOCHRSI (14): With a value of 1, it gives a ‘Buy’ signal. This indicates that the current position of the price is close to the overbought zone and signals that prices may rise further.
- MACD (12.26): It gives a ‘Buy’ signal with a value of -1.4163. The MACD indicator suggests that there may be a reversal in price trends and an upward movement may begin.
- ADX (14): With a value of 23.79, it gives a ‘Buy’ signal. This suggests that the strength of the trend is increasing, but it is still not a very strong trend.
Moving Averages
Moving averages are used to assess the average trend of an asset’s price movement. This data shows that short-term moving averages (such as EMA 10, SMA 10) give a ‘Buy’ signal, while long-term moving averages (such as EMA 100, SMA 200) give a ‘Sell’ signal. This signals that there may be a short-term bullish trend, but the long-term trend is still downwards.
- EMA (10) and SMA (10): The signals are in the ‘Buy’ direction, which indicates that the short-term price action is favourable.
- EMA (20) and SMA (20): Again signalling ‘Buy’, indicating a short-term uptrend.
- EMA (30) and SMA (30): Gives a ‘Buy’ signal, indicating that the uptrend may continue.
- EMA (50) and SMA (50): Gives a ‘Sell’ signal, indicating that a longer-term correction or a downward movement may begin.
- EMA (100) and SMA (100): Signalling ‘Sell’, indicating continued long-term weakness.
- EMA (200) and SMA (200): Signalling ‘Sell’, indicating the continuation of a very long-term downtrend.
You can also freely share your thoughts and comments about the topic in the comment section. Additionally, don’t forget to follow us on our Telegram, YouTube, and Twitter channels for the latest news and updates.


