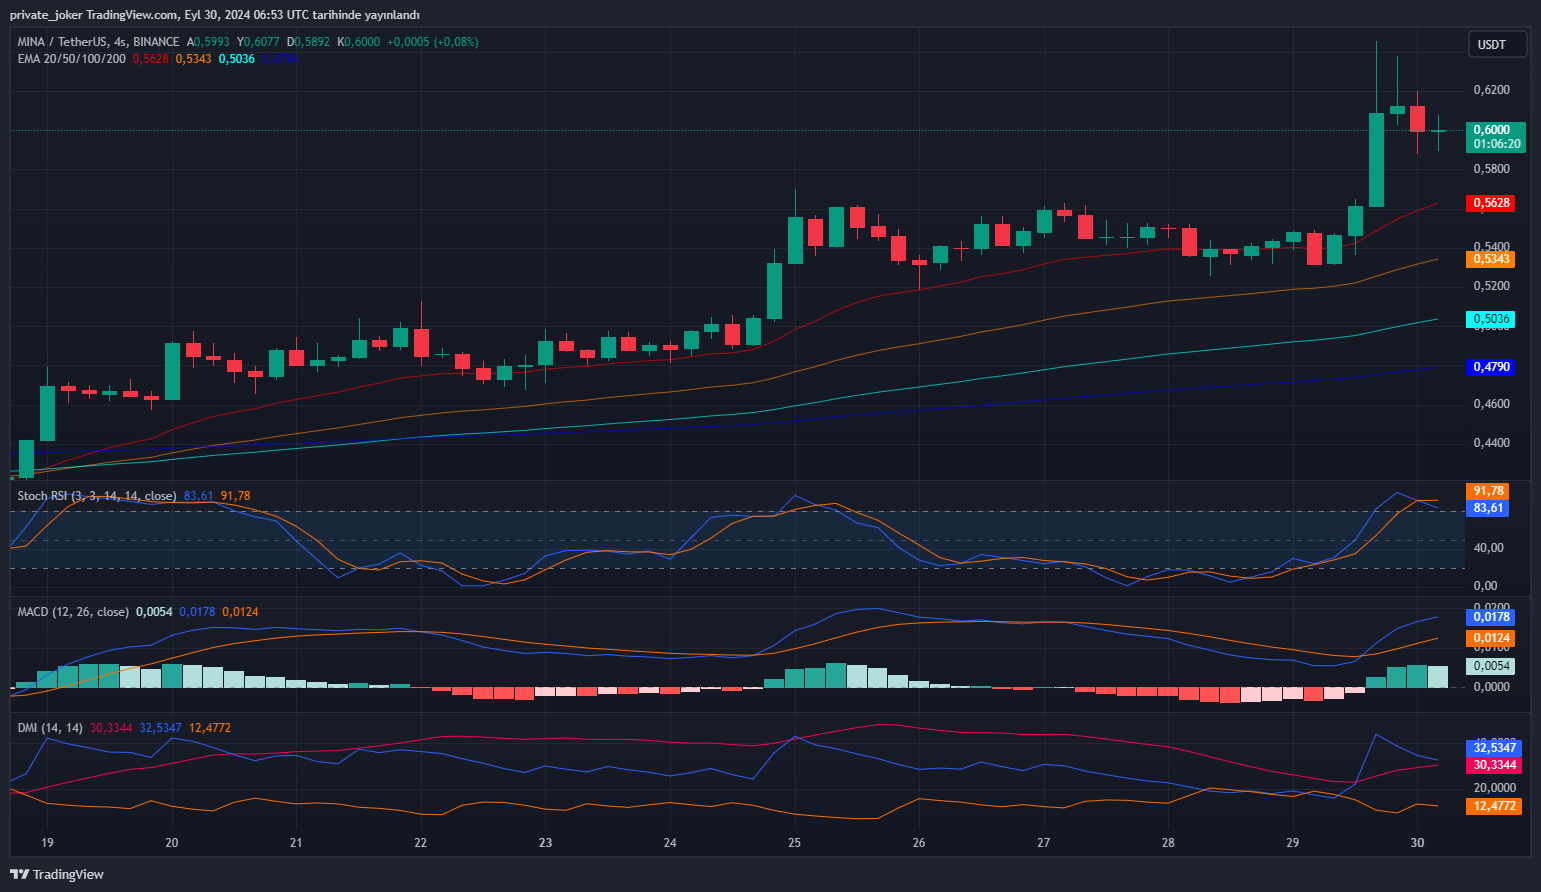
Showing a 10.57% growth in market capitalization, Mina Protocol (MINA) has had a mix of market action over the past week, now sitting at $693.86 million. With a 632.83% rise to $97.02 million, MINA’s price right now is $0.5965; trading volume for the token has surged. Examining Mina’s technical indicators, moving averages, and general market performance this weekly can help one to have a whole picture of its present market situation.
Technical Indicators: Mixed Sentiment, Mostly Positive
With six buy signals, two neutral ratings, and one sell signal, Mina’s technical indicators exhibit a generally “strong buy” attitude. The salient features of the technical study are listed below:
- RSI (14): The Relative Strength Index stands at 49.17, indicating a neutral position. This suggests that the market is balanced and that MINA is neither overbought nor oversold, leaving room for potential movement in either direction.
- Stochastic Oscillator (9,6): With a value of 50.764, this indicator also shows a neutral reading, suggesting that neither buyers nor sellers are currently in control.
- Stochastic RSI (14): The Stochastic RSI is overbought with a value of 100, indicating caution. This shows that the price may have risen too quickly in the short term, potentially leading to a correction.
- MACD (12,26): The Moving Average Convergence Divergence (MACD) gives a sell signal, showing bearish momentum in the short term.
- ADX (14): At 36.901, the Average Directional Index signals a buy, indicating that the current trend has strength and may continue.
- Williams %R: This indicator is also overbought at -10.749, suggesting caution in the short term.
- CCI (14): The Commodity Channel Index shows a buy signal with a value of 186.4099, indicating strong upward momentum.
- Ultimate Oscillator: At 61.367, this indicator gives a buy signal, suggesting continued upward pressure on the price.
- ROC (Rate of Change): The Rate of Change indicator stands at 18.625, signaling a buy and showing that MINA is experiencing strong positive momentum.
Though there are some brief warning signals, most technical indicators show MINA’s near-term continuing positive activity.

Moving Averages: Mixed Signals, Neutral Outlook
With six purchase indications and six sell signals, the moving averages show a more balanced picture that indicates a neutral attitude generally.
- Short-Term Moving Averages (MA5, MA10, MA20): The short-term moving averages show buy signals, suggesting that MINA is experiencing positive momentum in the near term. The simple and exponential moving averages for the 5-day, 10-day, and 20-day periods are all signaling buy, supporting a short-term bullish outlook.
- Medium- and Long-Term Moving Averages (MA50, MA100, MA200): However, the medium- and long-term moving averages show sell signals, indicating that MINA may still be facing some resistance in breaking through key price levels. The 50-day, 100-day, and 200-day moving averages are all giving sell signals, suggesting potential downward pressure in the longer term.
This mixed picture captures market uncertainty whereby long-term strength might not yet be able to underpin short-term gains.
Financial Performance: Significant Market Activity
Mina has shown substantial market activity, as reflected in its financial performance:
- Market Capitalization: MINA’s market cap has risen by 10.57%, reaching $693.86 million. This increase indicates growing investor confidence and interest in the token.
- Trading Volume: The 24-hour trading volume saw a massive spike of 632.83%, reaching $97.02 million. This surge in trading volume highlights strong liquidity and increased investor activity, making MINA an attractive asset for short-term traders.
- Volume-to-Market Cap Ratio: The volume-to-market cap ratio stands at 13.66%, suggesting that a notable portion of the market cap is being actively traded. This level of liquidity supports the idea that MINA remains a dynamic asset in the market.
You can also freely share your thoughts and comments about the topic in the comment section. Additionally, don’t forget to follow us on our Telegram, YouTube, and Twitter channels for the latest news and updates.


