What do the on-chain data indicate as the Bitcoin (BTC) Halving approaches? Is it possible to predict just by reading the charts? Here are the details.
When Will Bitcoin (BTC) Halving Occur?
It is estimated that there are approximately 50 days left for the Bitcoin (BTC) halving process. As the expectation of Bitcoin halving increases, the number of large investors entering the market increases, while old investors are expecting tough corrections from the market. There are important analyses we can do to precautions as investors. At first glance, the most important of these seems to be market manipulations, fake liquidations shown by whales, they’re trying to benefit from FOMO. FOMO is briefly defined as the fear of missing out on the present and leads to the investor making panic transactions and benefiting the exchange / major investors.
So How Do We Do a More Reliable Analysis?
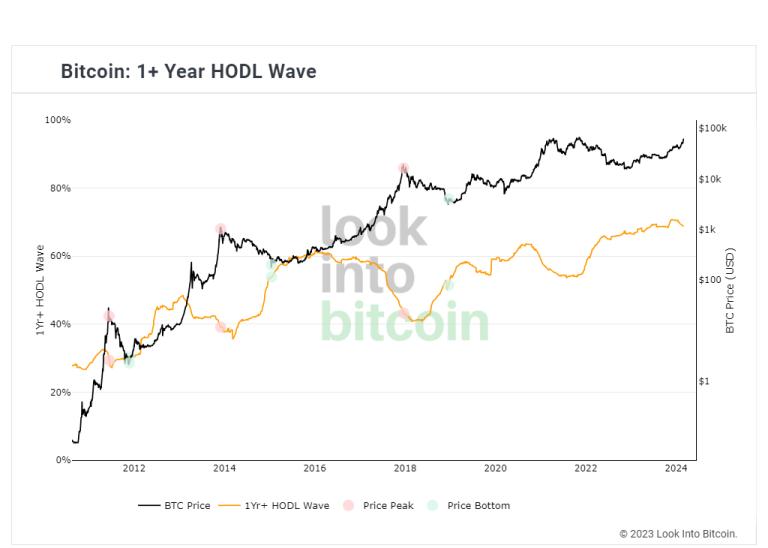
Today, many people, including new investors, can do analysis over the chart, but to avoid falling for false moves, especially during the pre-hardening period, we need to examine the on-chain data as well. There are some data that cannot be changed by instant transaction movements. One of these is the “+1 Year HODL Wave” chart which we can access for free on the lookintobitcoin.com site. Because it requires a long time to be able to manipulate. It shows us the BTC price in proportion to the rate of whales holding BTC for more than 1 year. Let’s examine the current data together.

As we can see here, we understand that as the HODL amount increased in the past, the price movement pulled itself together and caused a linear crash. When the HODL amount decreased a little, we see that the price progressed towards the peak region. The investor who reduces the amount of BTC in his hand directs to other coins, igniting the sparks of the altcoin rally. Looking at May 4, 2024, we see that the HODL amount has made a small withdrawal and the price is heading upwards. This brings the question, “Is money being transferred to altcoins?” We will see the answer to these questions more clearly with the price movements in the coming days. You can watch our on-chain analysis series from the Coin Engineer Youtube channel to follow the on-chain data yourself on chain analysis and you can access many useful content on how to follow on-chain data. See you in another blog post!


