We are evaluating the chart formation, market trends, trading volume and possible future moves of Render RNDR.
You might like: 26 Altcoins That Will Be Unlocked This Week!
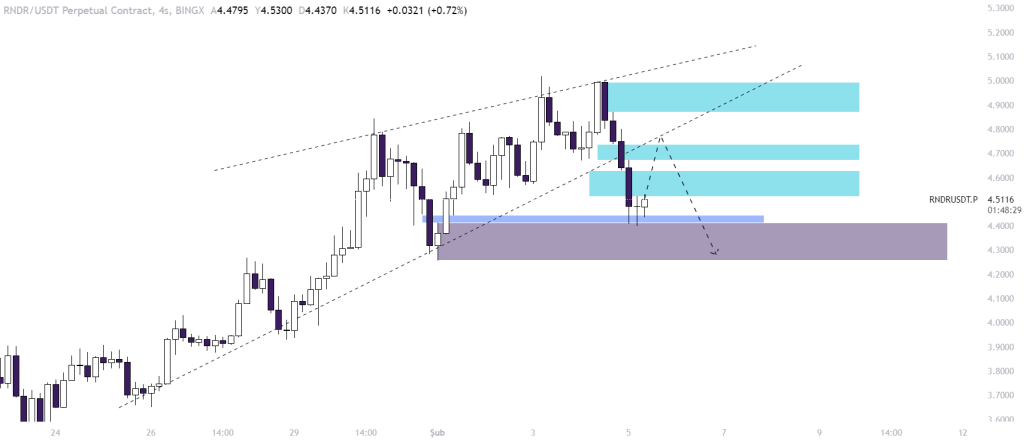
Our rising wedge formation, which has been creating an upward trend in RNDR for a long time, broke down and fell. The price, which filled the gap created by the fall, seems to have the potential to rise again. Currently, if the price decides to rise to fill the gaps it left above and also retreats with a re-test movement to the breakout point, we can see if the declines will continue.

The critical point now is whether a reaction will be received from the lower band of the breakout. If the price manages to get back into the wedge, the expectation of a decline will be shelved and a new uptrend will start.

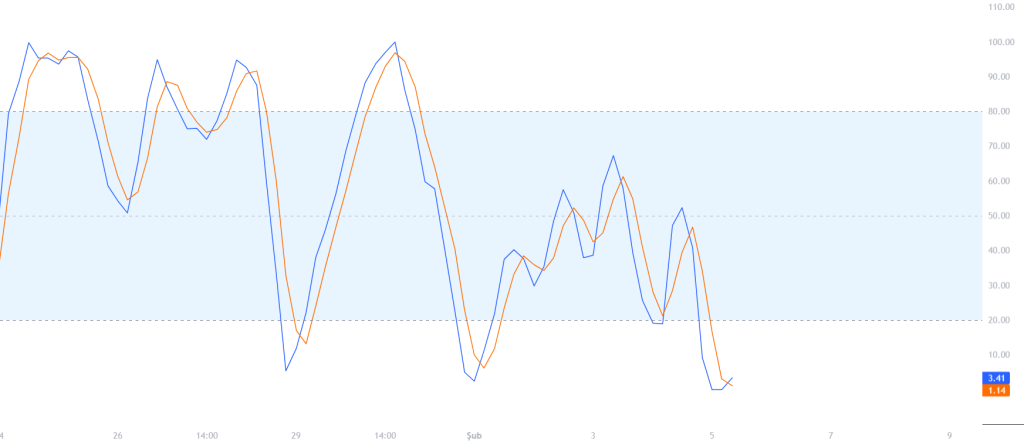
Stochastic RSI is currently giving a very nice bullish signal and the intersection after the extreme lows is shown as a bullish signal by Stochastic RSI.

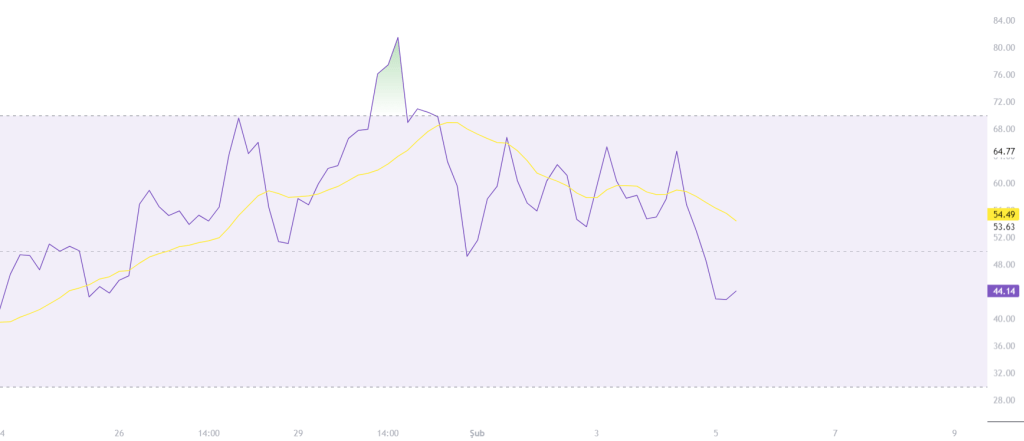
The situation on the RSI side is the same, it gives positive signals for the upward trend. If the expectation is realized, the price may rise to the breakout zone.
Render (RNDR) Market Data
- Market Cap: $1,698,480,925 (#45 Ranking)
- Volume (24h): $138,778,410 (#35 Ranking)
- Volume / Market Cap (24h): %6.55
- Circulating Supply: 376,146,336 RNDR (%70.06)
- Total Supply: 531,039,933 RNDR
- Maximum Supply: 536,870,912 RNDR
- Fully Diluted Market Cap: $2,424,502,203
You can easily buy and sell RNDR Tokens on Global Exchanges such as Binance, BitGet, Kucoin, Mexc, Houbi and Gate.io. If you want to benefit from the discount link specially defined for Coin Engineer followers, you can use our referral code by clicking on the exchange you want to register.


