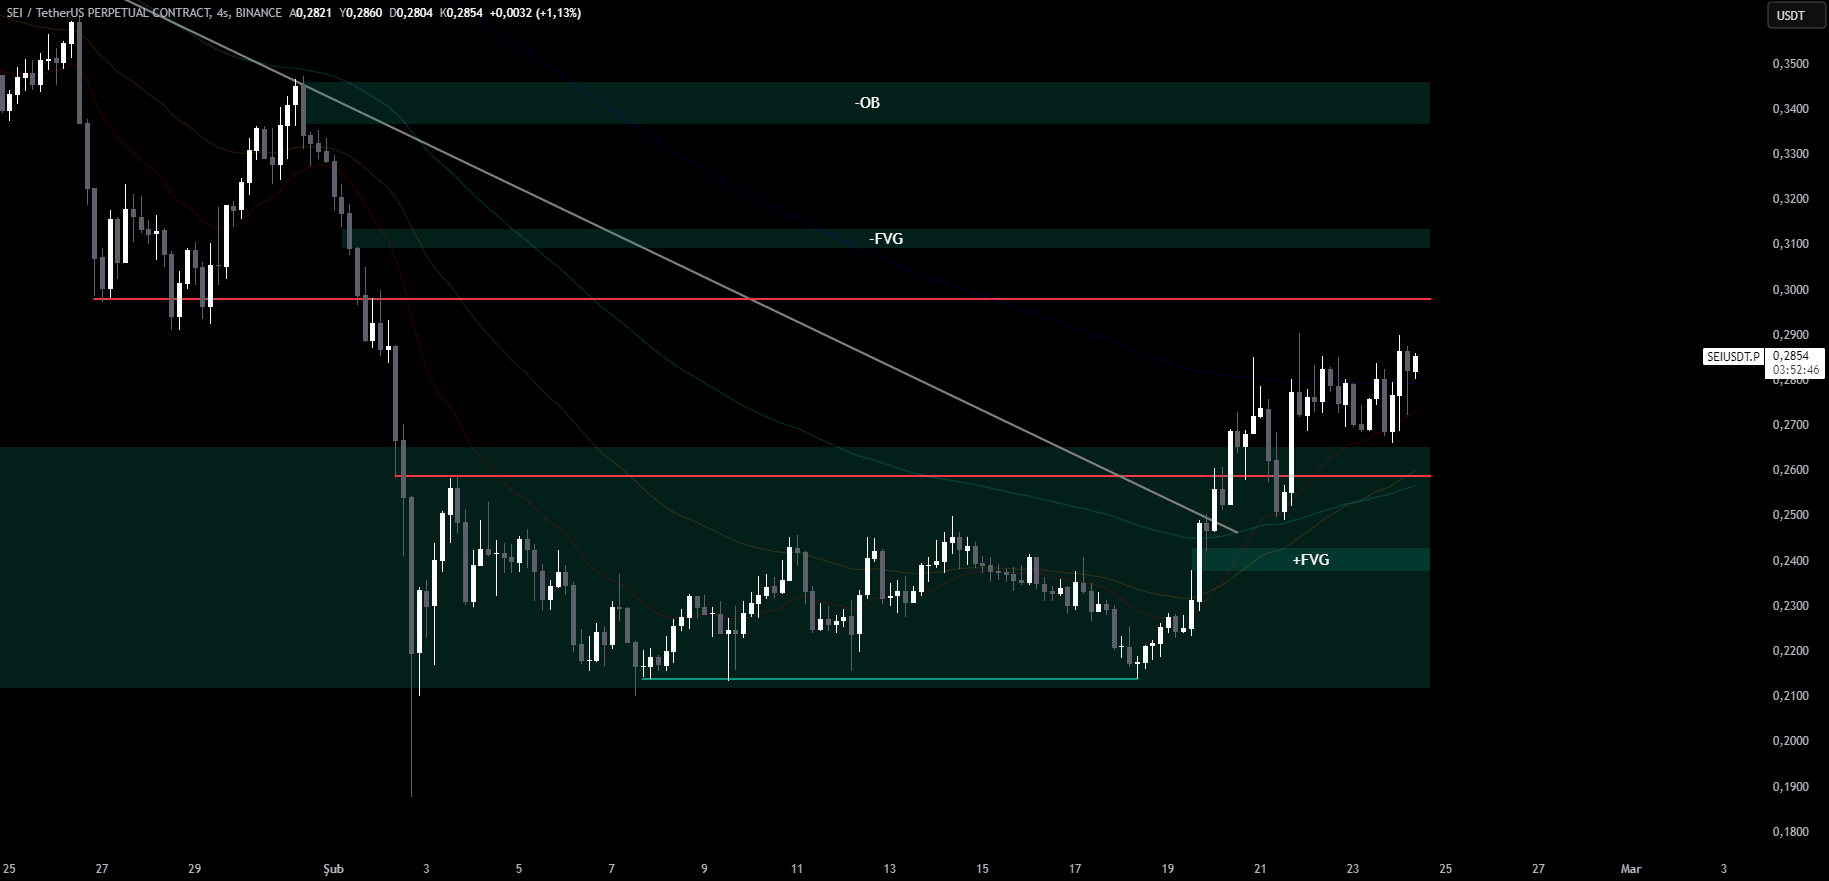
In our previous analysis, we mentioned that the break of the $0.26 resistance led to an impressive 11% increase in price. Currently, SEI/USDT is trading between the $0.26 support and the $0.30 resistance. The price action around these levels is crucial to determine the short-term direction of the asset.
Price Movement Between $0.26 Support and $0.30 Resistance
At the moment, the price is hovering between the $0.26 support and $0.30 resistance, forming a key range for price action. The $0.26 support level is critical for maintaining the current bullish momentum. If this level is broken, the price could head towards the FVG (Fair Value Gap) region below, which would act as the new support level. In this case, further downside movement may occur.
You Might Be Interested In: Elon Musk Talks About the Name of a New Memecoin!

On the other hand, if the price manages to break the $0.30 resistance, the next key resistance level will be found at the FVG region just above, which could trigger further upward movement. Breaking through $0.30 would indicate a potential continuation of the bullish trend, with higher targets to be tested.
You can also freely share your thoughts and comments about the topic in the comment section. Additionally, don’t forget to follow us on our Telegram, YouTube, and Twitter channels for the latest news and updates.


