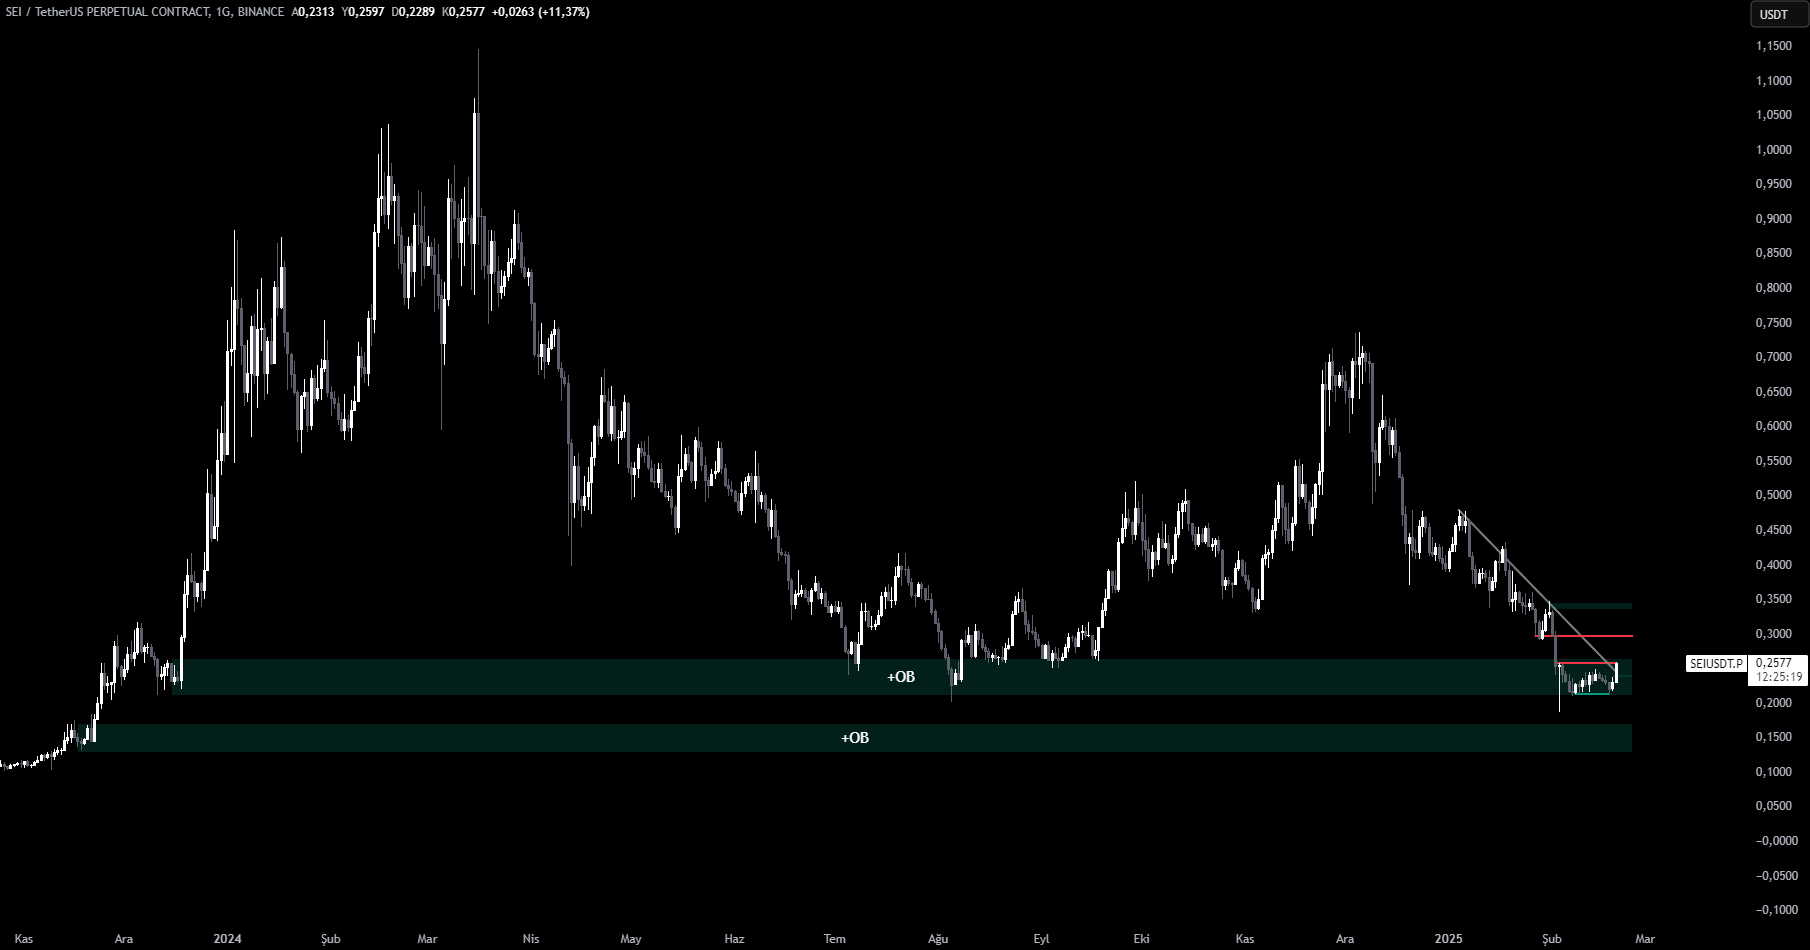
SEI is currently trading at a crucial order block level on the daily chart. This region is acting as a strong support for buyers. However, if the price loses this level, the lower order block could serve as an even stronger support level. Investors should closely monitor how the price reacts to this zone.

Has the Downtrend Broken?
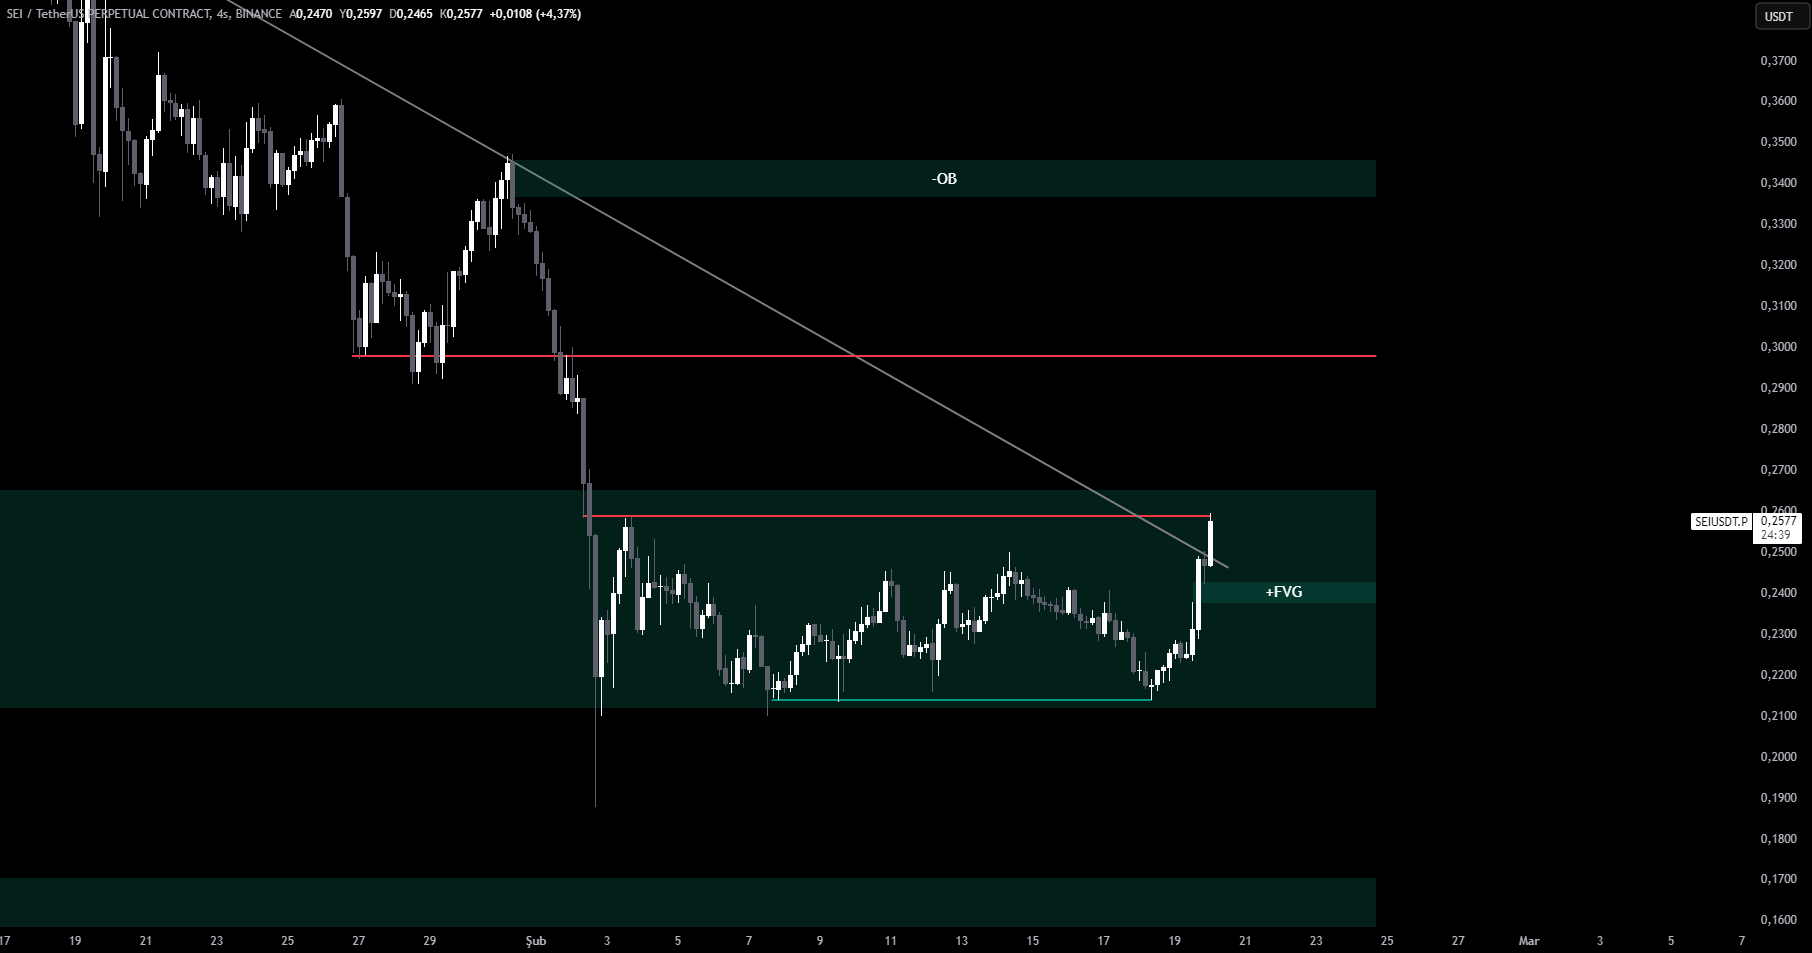
Looking at the 4-hour chart, the price appears to have broken the downtrend, but a confirmed candlestick close has yet to occur. At this stage, the $0.26 level may act as resistance and hold the price in this range. If the price fails to break above this level, a downside movement could begin, with the bullish FVG zone below serving as potential support.
You Might Be Interested In: Elon Musk Talks About the Name of a New Memecoin!

SEI Price Targets
If the $0.26 resistance is broken, the uptrend could accelerate, with the first target being the $0.30 level. The $0.30 level is a critical threshold for further upward movement. If this level is also surpassed, the price could target the bearish order block in the upper region.
These key levels in SEI’s price action provide important signals for both short- and medium-term traders. Monitoring price movements closely is essential for making informed buy and sell decisions.
You can also freely share your thoughts and comments about the topic in the comment section. Additionally, don’t forget to follow us on our Telegram, YouTube, and Twitter channels for the latest news and updates.


