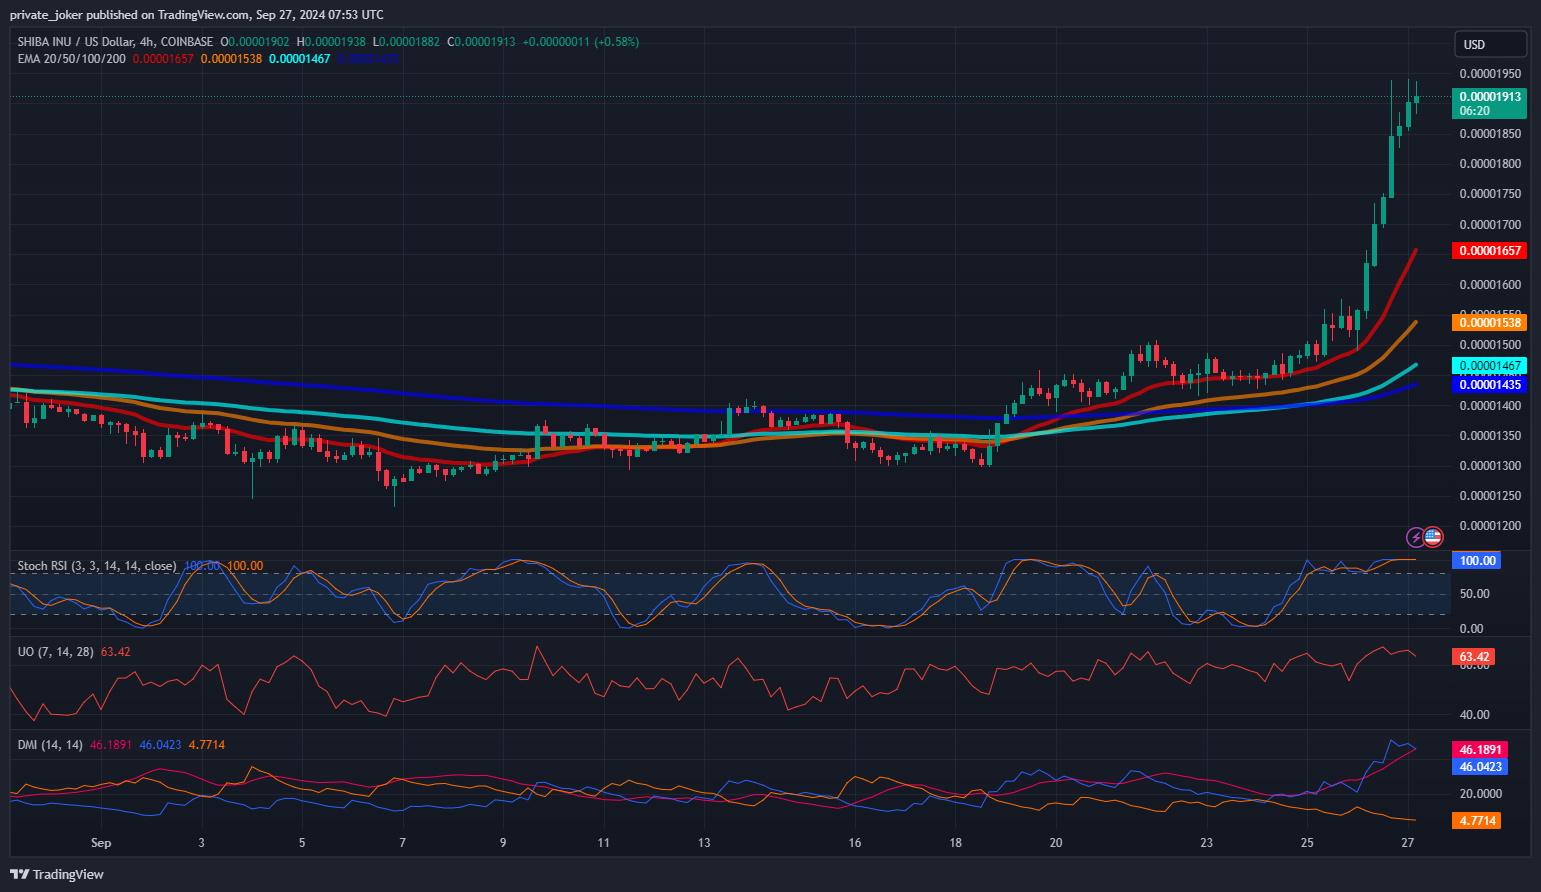
With technical indicators showing a strong buy attitude, Shiba Inu (SHIB) has shown notable positive momentum in the past week. The market activity of the token has increased; both short- and long-term moving averages support the hopeful view of the meme coin. To better understand SHIB’s present market posture, let’s examine closely its technical indicators, moving averages, and financial performance.
Technical Indicators: Buy Sentiment Dominates
With four buy signals and five neutral ratings, Shiba Inu’s technical indicators point generally in a positive direction. Here are the main points:
- RSI (14): The Relative Strength Index (RSI) stands at 54.539, indicating a neutral position. This suggests that SHIB is not overbought or oversold, providing room for potential upward movement.
- Stochastic Oscillator (9,6): With a value of 47.245, this indicator remains neutral, showing no immediate bullish or bearish momentum in the short term.
- Stochastic RSI (14): This indicator shows a value of 100, signaling an overbought condition. While this suggests some caution, it also reflects strong demand for SHIB in the current market.
- CCI (14): The Commodity Channel Index is at 94.207, signaling a buy. This suggests that SHIB is experiencing positive price action and could continue to rise in the short term.
- Ultimate Oscillator: At 65.714, the Ultimate Oscillator also signals a buy, confirming bullish momentum.
Although several signs, including the Stochastic RSI and Williams %R, show overbought circumstances, overall the mood is still good and points toward ongoing expansion.

Moving Averages: Strong Buy Sentiment Across All Timeframes
The moving averages of Shiba Inu’s highlight even more the positive attitude. Every one of the twelve purchase signals indicates robust upward momentum over several timeframes:
- MA5, MA10, MA20: Both simple and exponential moving averages for short-term periods show buy signals, indicating strong near-term momentum for SHIB. This suggests that the token has been performing well over the past few days and is likely to continue on this trajectory.
- MA50, MA100, MA200: Long-term moving averages also signal a buy, which suggests that SHIB’s upward trend is sustainable in the medium and long term. Investors looking for longer-term gains may find these signals particularly encouraging.
With strong buy signals across all significant timeframes, SHIB’s moving averages offer a good basis for ongoing expansion overall.
Financial Performance: Significant Market Activity
Strong market performance is reflected in Shiba Inu’s financial data; trading volume and market capitalization both show an appreciable rise:
- Market Cap: Shiba Inu’s market capitalization has risen by 22.11%, now standing at $11.29 billion, placing it at #13 among cryptocurrencies. This increase in market cap signals growing interest in SHIB and suggests that the token is gaining more traction among investors.
- 24-Hour Trading Volume: The 24-hour trading volume has surged by 231.84%, reaching $1.39 billion. This significant rise in trading volume indicates strong liquidity and market activity, making SHIB an attractive asset for both short- and long-term traders.
- Volume-to-Market Cap Ratio: The volume-to-market cap ratio stands at 12.38%, suggesting that a substantial portion of SHIB’s market cap is actively being traded. This liquidity is crucial for traders looking to enter or exit positions efficiently.
You can also freely share your thoughts and comments about the topic in the comment section. Additionally, don’t forget to follow us on our Telegram, YouTube, and Twitter channels for the latest news and updates.


