The cryptocurrency market continues to trend downward. While the metrics are not good in the market, the claims that Japan will continue to increase interest rates caused panic at the opening of the US stock exchanges and caused sales. With the outflows seen in the US, declines occurred in other cryptocurrencies, especially Bitcoin. While Bitcoin continued to fall by 2.5 percent to $ 57,600, the situation is not much different in Ethereum. Ethereum also continued to fall by nearly 4 percent to $ 2,400.
So what is the latest situation in SKL Coin? What are the support and resistance levels in SKL?
SKL Coin Technical Analysis
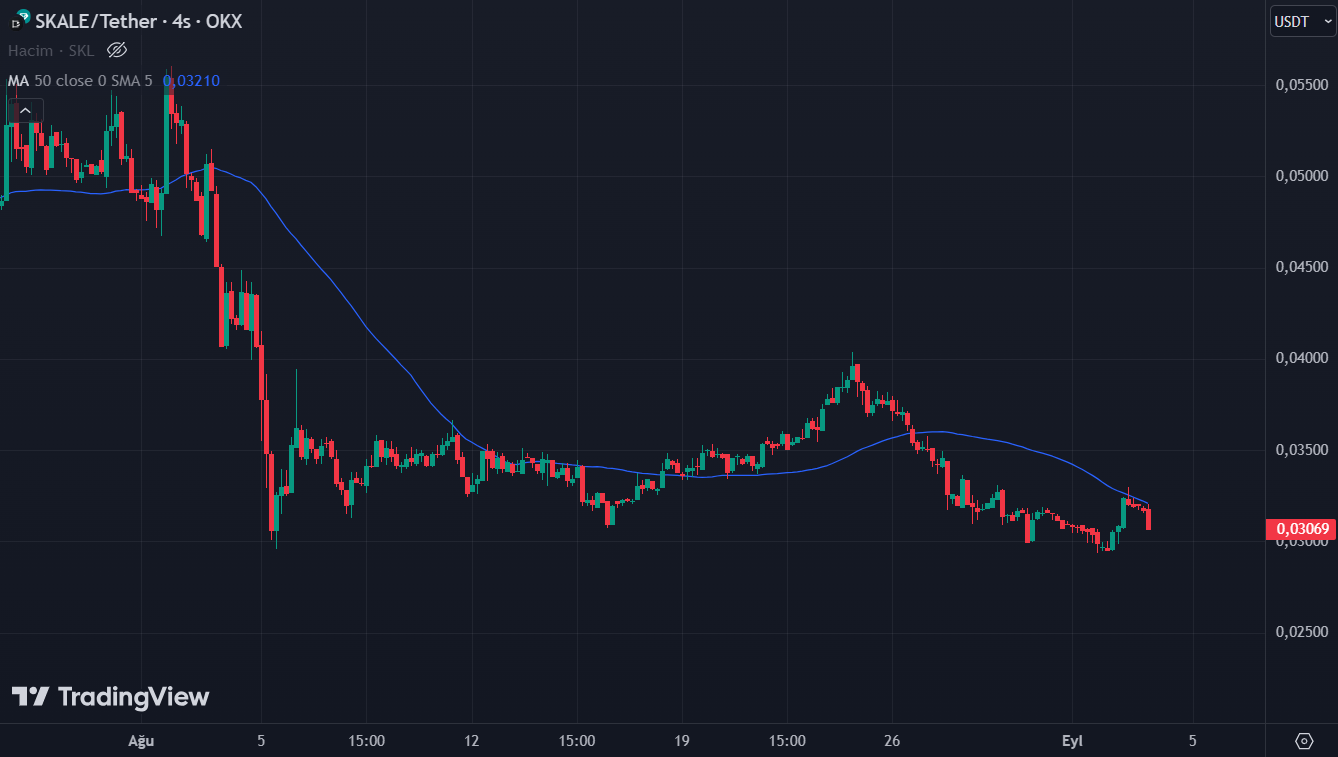
When we look at the 4-hour chart of SKL Coin, we can see that it is in a long-term downtrend. With this downtrend, the price area has retreated to $ 0.03.

According to TradingView data, the cryptocurrency, which has spent the last 24 hours with a 4 percent decrease, may receive a reaction from its current support position. Of course, in case of a possible deepening decline in Bitcoin, the area we will follow in SKL will be 0.003. The resistance area of SKL is at $ 0.032.
You can also freely share your thoughts and comments about the topic in the comment section. Additionally, don’t forget to follow us on our Telegram, YouTube, and Twitter channels for the latest news and updates.


