Stacks STX Chart Analysis and Price Prediction! We are evaluating the chart formation, market trends, trading volume, and potential future moves by Stacks STX.
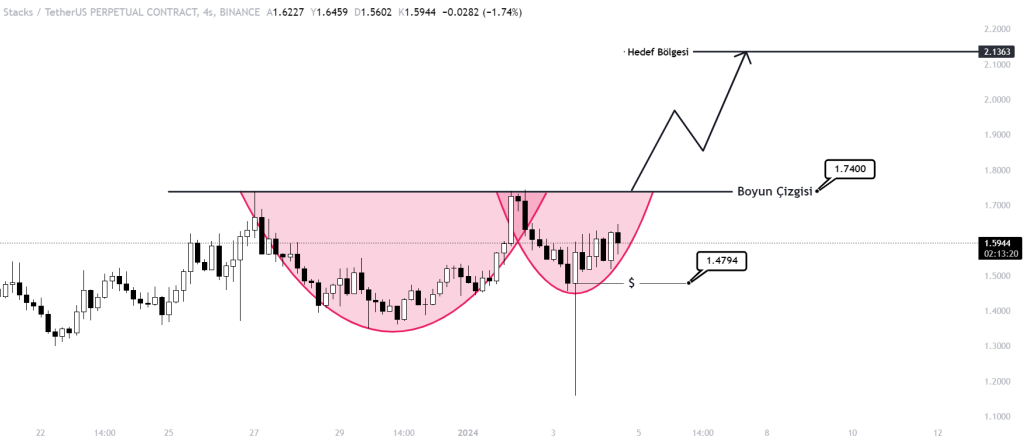
The STX coin chart shows a cup and handle formation, and the formation is completed by breaking the neckline at 1.74 and closing above it.
You might like: STX (Stacks) – What is it? What are the important levels for buying?
If our graph starts to close above the 1.74 level, the formation will be completed and it may be an appropriate time to take a LONG position. Our target point is set at 2.13. However, there is a noteworthy detail, there is excess liquidation accumulated at the 1.4794 level. There is 741.90K liquidation accumulated here and fiat can move to this level instantly.
STX (Stacks) is a blockchain platform designed to create decentralized applications. This platform uses the Bitcoin blockchain and uses a sidechain to process smart contracts.
Stacks are used to support smart contracts and decentralized applications, and allow users to develop applications on Bitcoin. This provides innovation and diversity within the Bitcoin ecosystem. STX tokens are used to pay transaction fees for Stacks and to vote on the network.
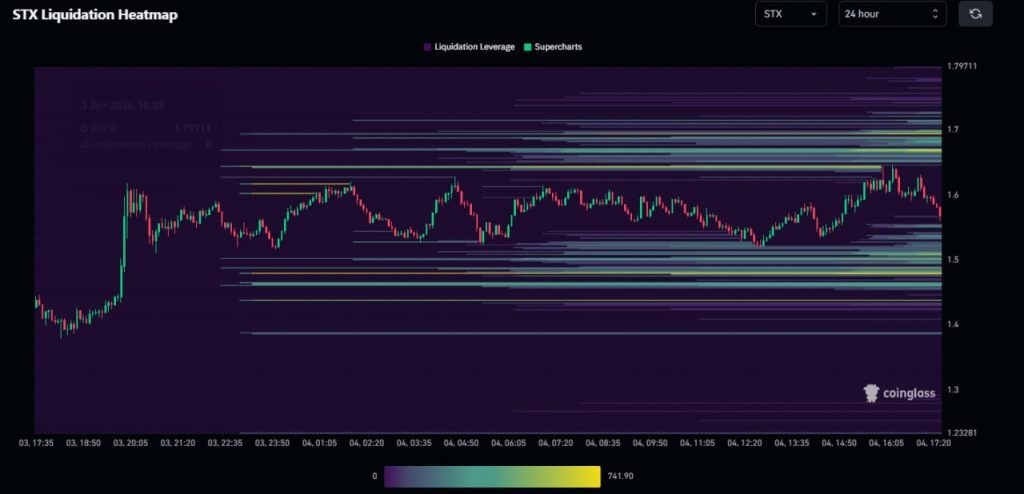
We observe intense liquidations at certain fiat levels in the liquidation heat map. In the charts, fiat usually moves in the direction of the accumulation of liquidation. We can also see that there are excess liquidation areas that need to be taken in the upper part of the STX chart.
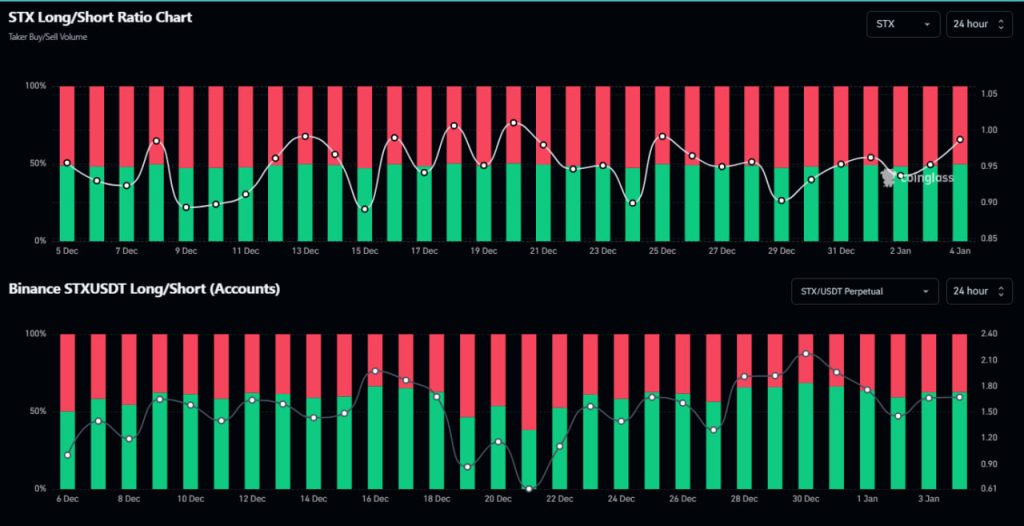
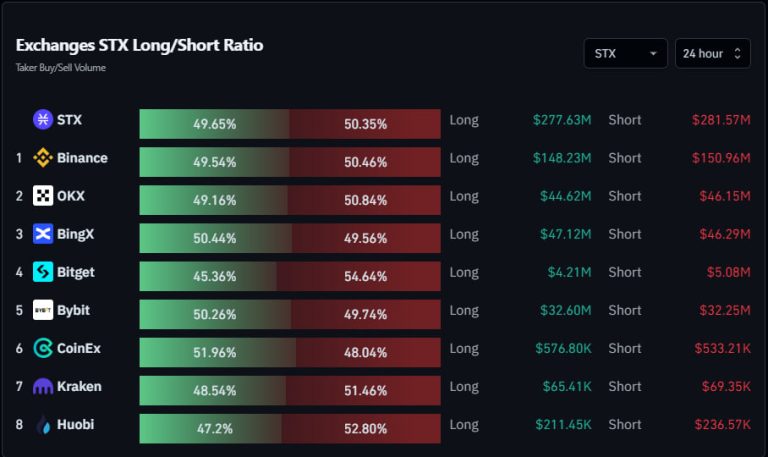
In general, when we look at the Long-Short ratios, we usually see that Short and Long positions are in balance. However, the situation looks a little different on Binance Exchange, and we observe that the number of users taking Long positions is high. This situation can trigger a small retracement and liquidation trend.
Stacks STX Market Data
- Market Cap: $2,333,505,185 (39th), 15.38% increase
- Volume (24h): $326,896,913 (43rd), 15.03% increase
- Volume / Market Cap (24h): 9.01%
- Circulating Supply: 1,430,573,011 STX (78.69%)
- Max Supply: 1,818,000,000 STX
You can easily buy and sell STX Token from global exchanges such as Binance, BitGet, Kucoin, Mexc, Huobi, and Gate.io. If you want to benefit from the discount link specifically defined for Coin Engineer followers, you can use our referral code by clicking on the exchange you want to register.
Analysis
The STX coin chart is currently in a cup and handle formation. This is a bullish formation that can lead to a significant price increase. If the coin breaks the neckline at 1.74 and closes above it, the formation will be completed and a LONG position may be appropriate.
The target point for the STX coin is set at 2.13. However, there is a risk of a small retracement to the 1.4794 level before the coin reaches this target. This is due to the excess liquidation accumulated at this level.
The Long-Short ratio on Binance is also in favor of the bulls. This suggests that there is more buying pressure than selling pressure in the market.
Overall, the technical indicators are bullish for the STX coin. However, it is important to be aware of the risk of a small retracement before the coin reaches its target point.


