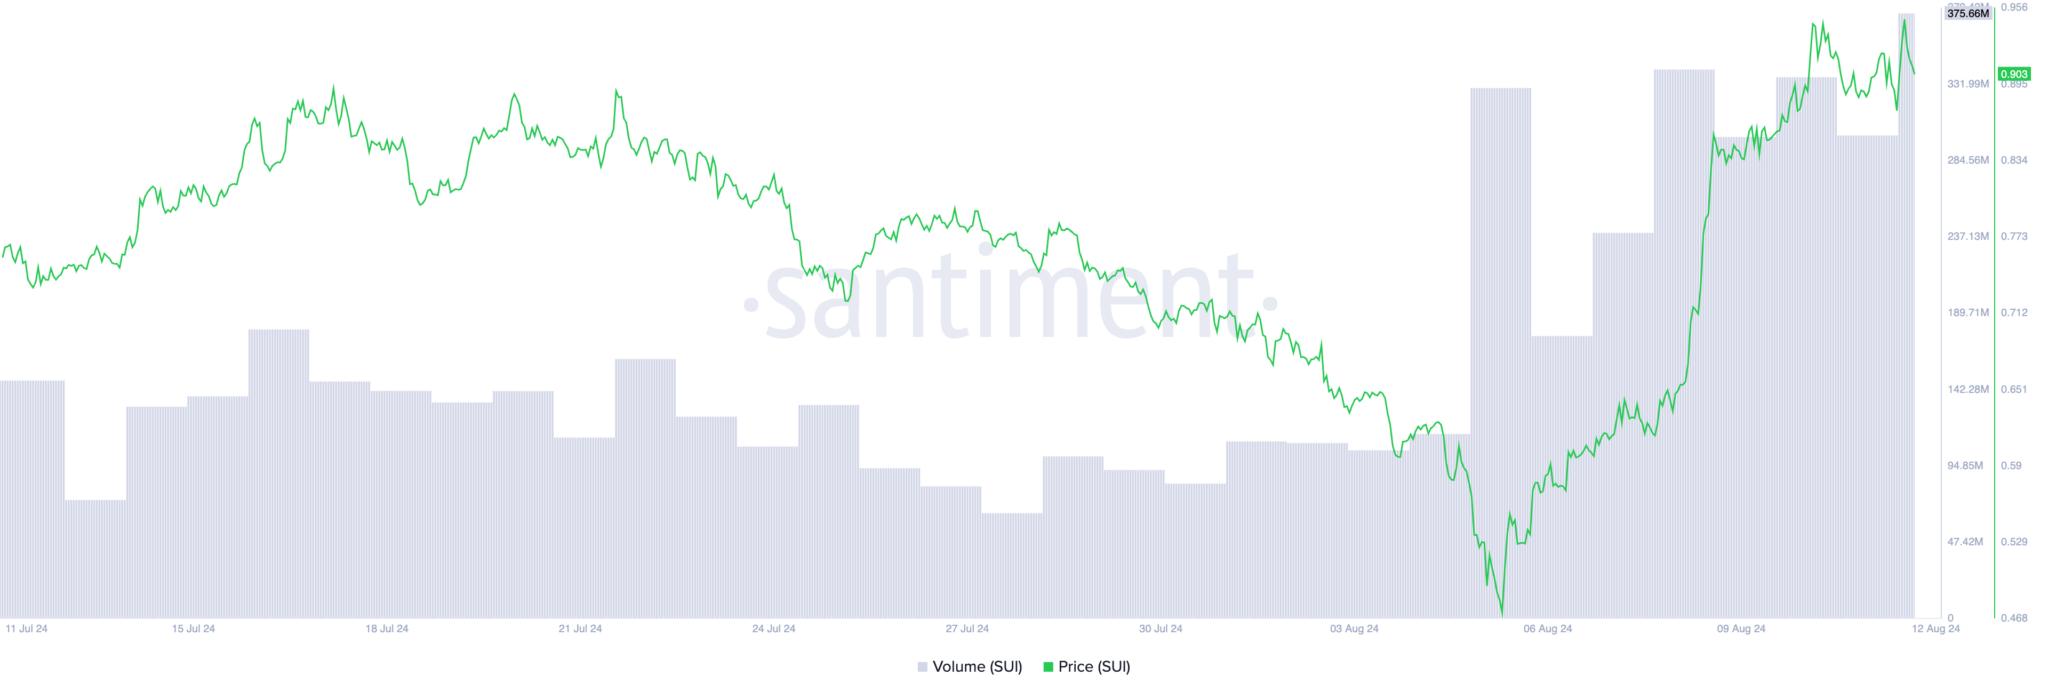
The native token of Layer-1 (L1) blockchain Sui Network, SUI, has seen an amazing price climb last week. Exchange hands at $0.90 at press time; the price of the altcoin has increased by 82% within the past seven days. Currently trading at its highest over the past thirty days, the altcoin is likely to keep increasing.

Over the past two days, SUI’s trade activity has exploded. Based on Santiment, the coin’s daily trading volume during the past 24 hours alone comes out to be $376 million, its largest since June 7. A rising price and trading volume for an asset suggest more activity in that coin. The price increase usually represents increased demand for the coin since more people are ready to acquire it, thereby increasing its value.
Related: What is SUI Coin? Sui Project Reviews

Moreover, the Moving Average Convergence/Divergence (MACD) indicator of SUI, evaluated on a one-day chart, supports the increase in cryptocurrency demand. Pressing time readings from the indicator shows zero lines and a blue MACD line resting above the orange signal. The MACD indicator finds the possible points of price reversal, trend direction, and changes in an asset. A MACD line above the signal line indicates that the short-term momentum is more robust than the long-term momentum. This usually indicates a decent moment to make purchases.
Additionally, verifying the uptrend and suggesting the continuation of the rally, the MACD line crosses above the zero line. This indicates that the market is sufficiently active in purchasing to maintain the price rise of the item.
You can also freely share your thoughts and comments about the topic in the comment section. Additionally, don’t forget to follow us on our Telegram, YouTube, and Twitter channels for the latest news and updates.


