Bitcoin’s consolidation around the $100,000 range is providing traders an opportunity to take a closer look at DOGE, SUI, PEPE, and FTM.
Bitcoin continues to face a tough battle between the bulls and bears at the $100,000 level. CryptoQuant contributor Percival mentioned in a Quicktake blog post on December 6 that Bitcoin’s weekly strength is weakening and it may enter a period of consolidation over time.
Short-term uncertainty and volatile price action have not changed analysts’ long-term bullish outlook on Bitcoin. WeRate co-founder Quinten François said in a post on X that Bitcoin is “entering the euphoria stage,” which could extend the rally for a maximum of 12 more months before a cycle peak is formed.
In addition to Bitcoin, Donald Trump‘s U.S. presidential victory has boosted the price of several altcoins. However, Hartmann Capital managing partner Felix Hartmann noted in a post on X that venture capitalists and teams may aggressively book profits in altcoins, which could result in a sharp downturn.
Bitcoin Price Analysis
Bitcoin is facing resistance at the psychologically significant $100,000 level, but the bulls are not rushing to exit the market.

Bitcoin’s tight consolidation near the $100,000 level increases the likelihood of an upside breakout. If buyers can push the price above $104,088, bullish momentum could strengthen, and the BTC/USDT pair may rise to $113,331 and then to $125,000.
The 20-day moving average ($95,285) should be watched as a crucial support level in the short term. If this level is broken, it would suggest that the bulls are quickly moving to book profits. The pair could then drop to $90,000 and subsequently to the 50-day simple moving average at $84,110.
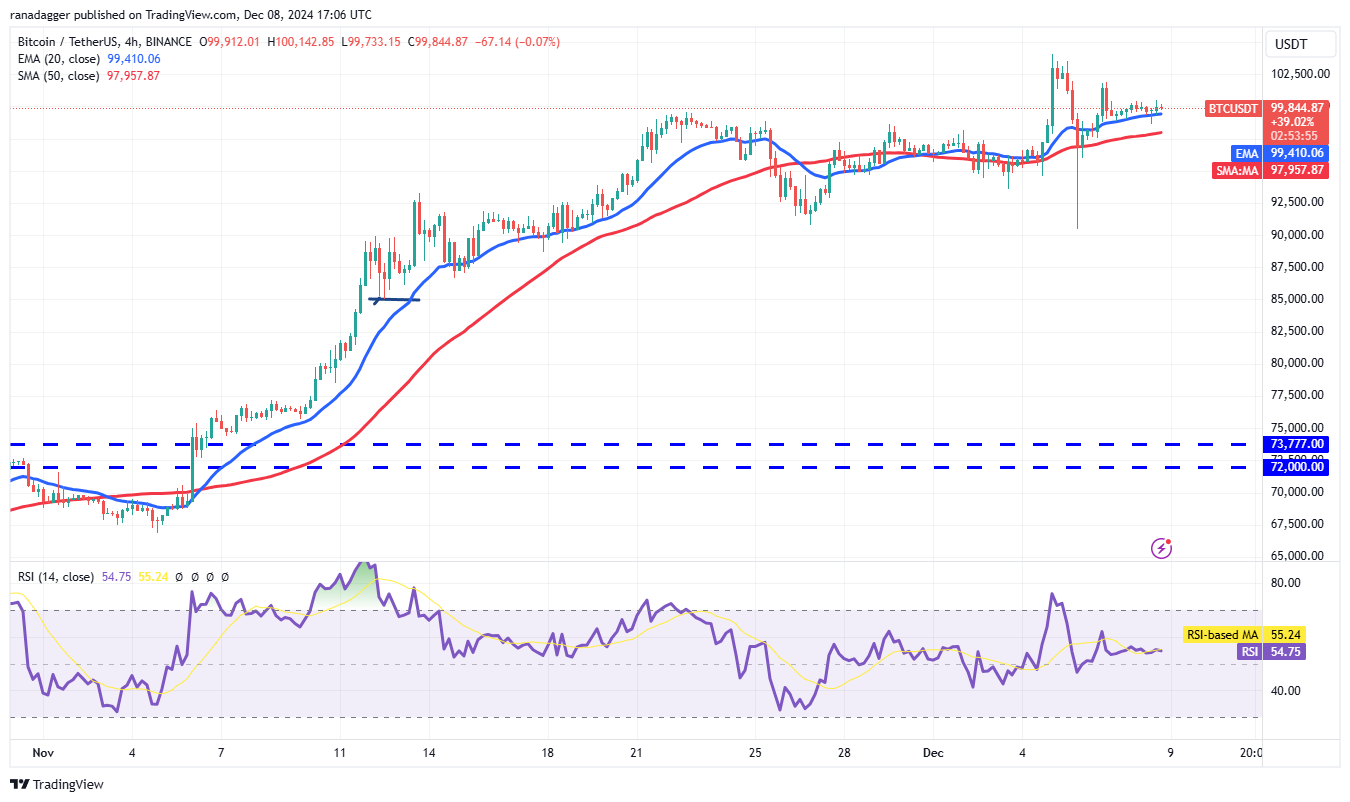
BTC/USDT 4 Hours Chart
The pair is trading above the moving averages, giving the bulls a slight edge. However, the upward move is expected to face strong resistance in the $101,900 to $104,088 range. A break above this level could initiate a rise in the pair to $113,331.
Conversely, a drop and close below the moving averages could lead short-term bulls to take profits. This could pull the price down to $90,000, where buyers are likely to step in.
If the price rebounds from the $90,000 level and moves above the moving averages, it could indicate the formation of a consolidation range. The pair may trade between $90,000 and $104,088 for some time.
DOGE Price Analysis
Dogecoin is gaining value within an ascending channel pattern, indicating that buyers have the upper hand.
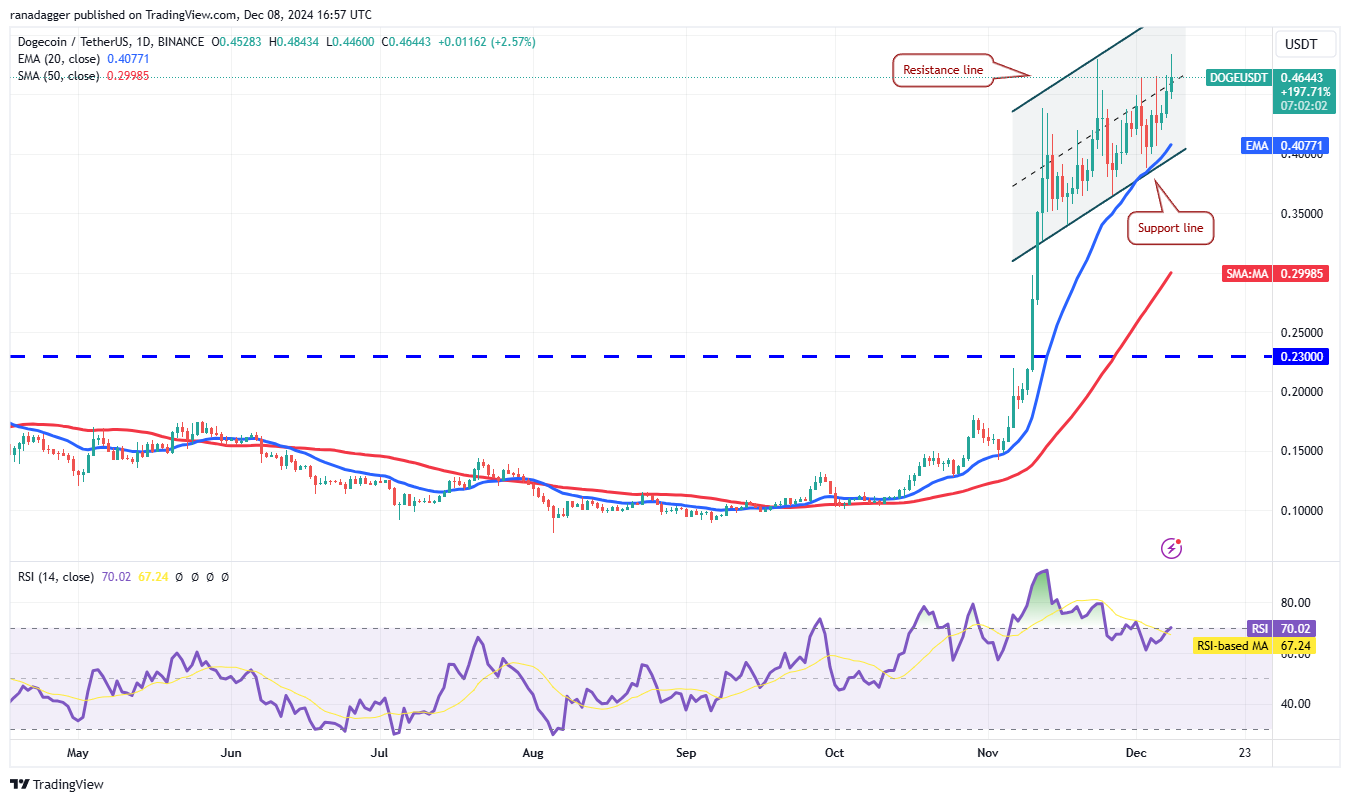
The bulls tried to push the price above the upper resistance at $0.48, but the bears resisted. If the price moves up from the current level or the 20-day EMA ($0.41), the bulls will attempt to push the DOGE/USDT pair toward the channel’s resistance line again.
The bears are expected to defend this resistance line with all their strength, as breaking above it could send the pair soaring to $0.60. If the bears want to prevent the rise, they will need to pull the price below the channel’s support line. In that case, the pair could drop to the 50-day SMA ($0.30).
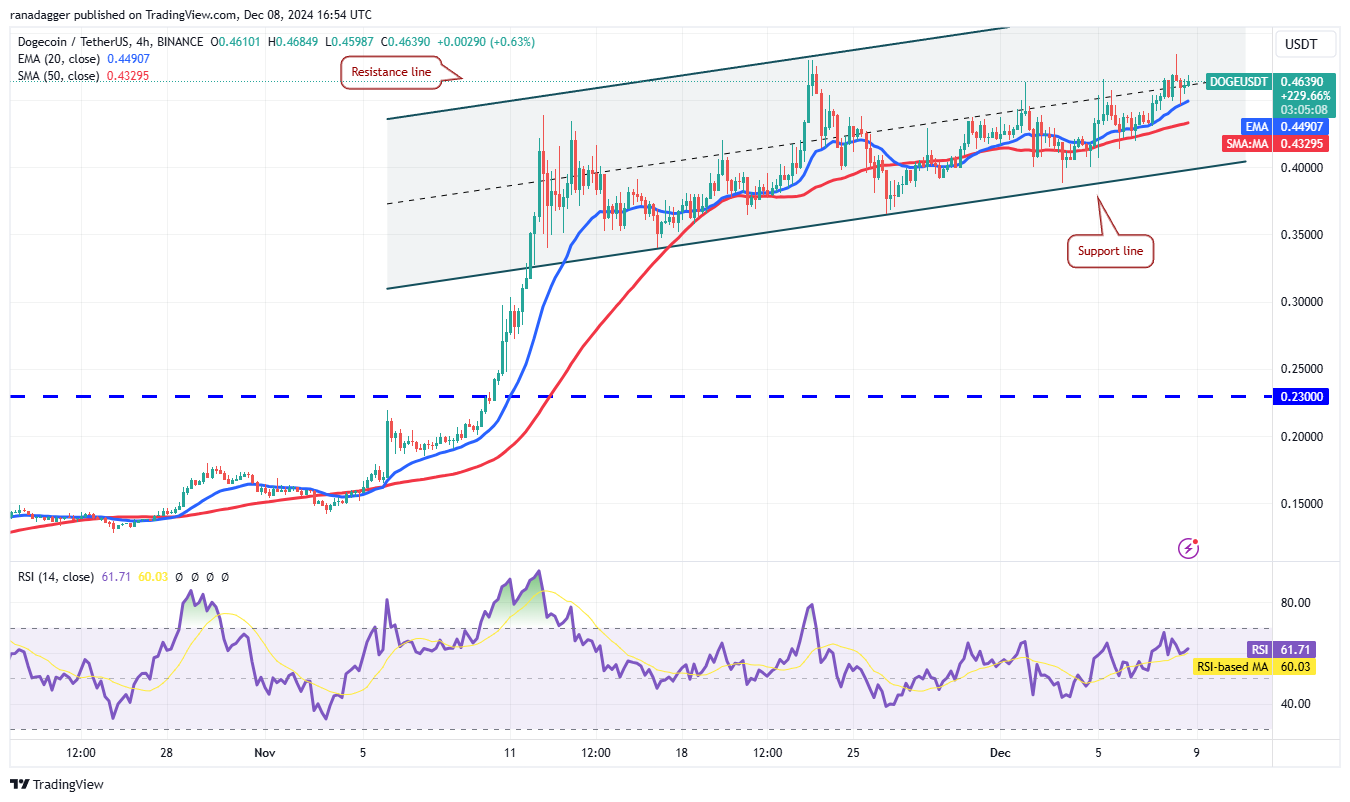
DOGE/USDT 4 Hour Chart
The pair is finding support at the 20-EMA, indicating positive sentiment. The bulls will attempt to break through the upper resistance at $0.48 again. If successful, the pair could rise to the channel’s resistance line.
If the price turns down sharply from the resistance line and drops below the 20-EMA, it would suggest that the pair may remain within the channel for some time.
On the other hand, a break and close above the resistance line would signal the start of the next leg of the uptrend toward $0.60.
SUI Price Analysis
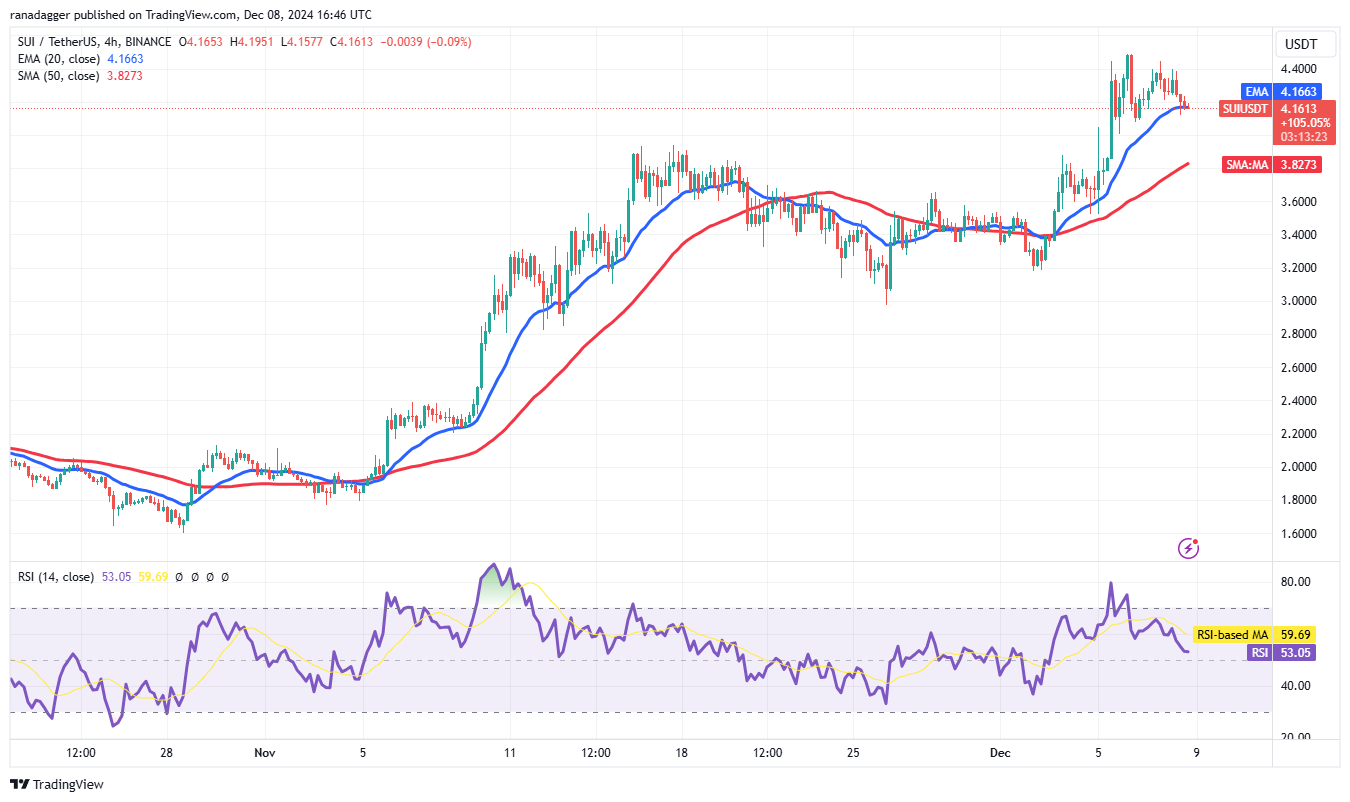
SUI is facing resistance around $4.50, but the bulls have not given much ground to the bears. This suggests that buyers are expecting the upward movement to continue.
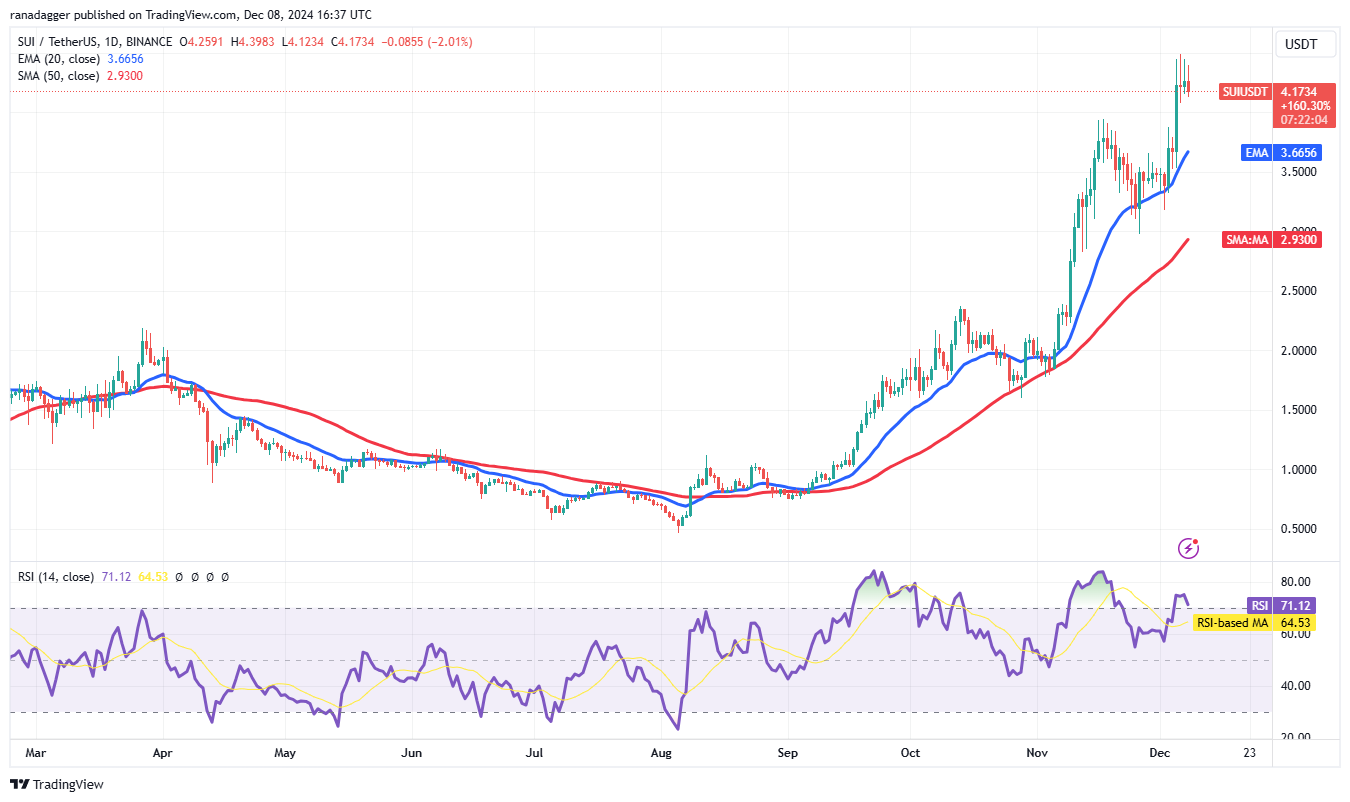
The SUI/USDT pair could drop to $3.94 and then to the 20-day EMA ($3.66). If the price rebounds from the 20-day EMA, the bulls will attempt to break the major resistance at $4.50. If successful, the pair could move into the next uptrend and rise to $5.31.
A minor concern is the developing negative divergence on the RSI. If the price falls below the 20-day EMA, it would indicate that the bulls are booking profits. This could lead to the pair pulling back to the 50-day SMA ($2.93).
SUI/USDT 4 Hour Chart
If the bulls fail to push the price above $4.50, a pullback to $4 may be initiated. This is an important support level to watch, as a strong bounce from here would increase the likelihood of a rally above $4.50.
On the other hand, a drop and close below $4 could indicate that the bears are trying to take control. In this case, the pair might slide to the 50-SMA level. If this support is also broken, the pair could decline further to $3.
PEPE Price Analysis
PEPE has reached the overhead resistance level at $0.000027, where bulls and bears are likely to battle for dominance.
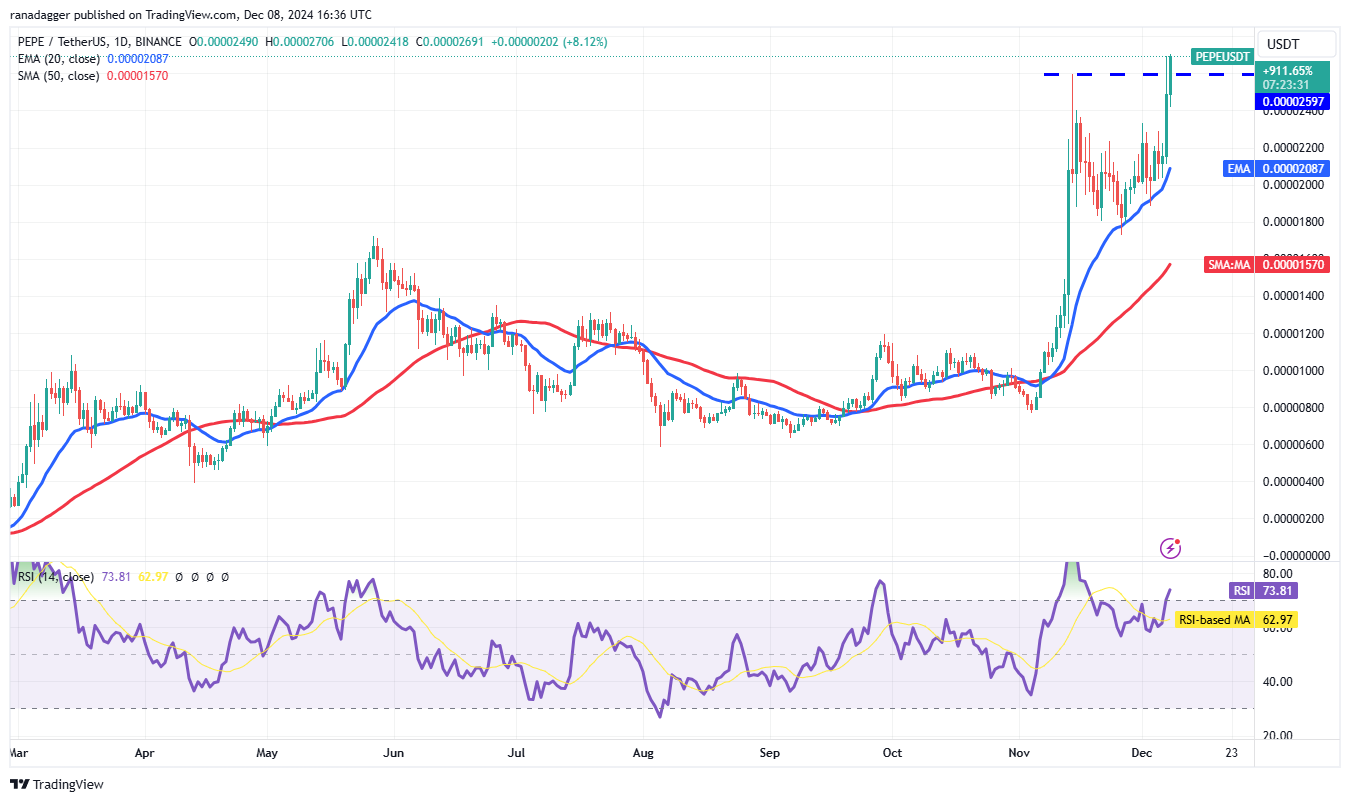
The 20-day EMA ($0.000021) is sloping upwards, and the RSI is in the overbought zone, giving an advantage to buyers. If the bulls manage to hold the price above $0.000027, the PEPE/USDT pair could rise to $0.000035 and then to $0.000044.
On the other hand, if the price turns down from $0.000027, it will indicate that the bears are defending this level strongly. The pair could then drop to the 20-day EMA. For the sellers to gain the upper hand, they would need to pull the price below the 20-day EMA.
PEPE/USDT 4 Hour Chart
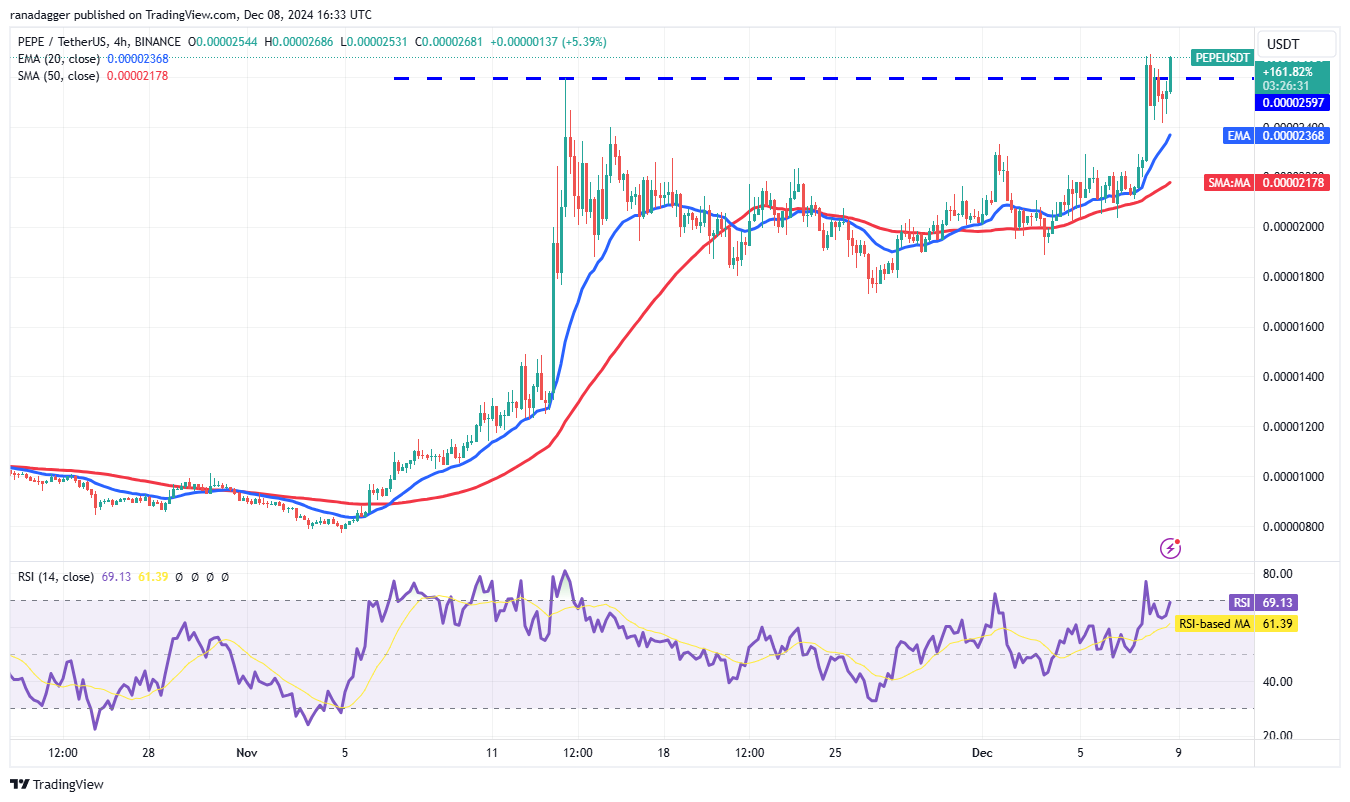
The bears pulled the price below $0.000024, but the bulls bought the dip to the 20-EMA. Now, the bulls are trying to push the price back above $0.000027. If they succeed, the pair could rise to $0.000035.
Time is running out for the bears. If they want to make a comeback, they need to quickly pull the price below the moving averages. In that case, the pair could slide to the strong support near $0.000017.
FTM Price Analysis
FTM broke above the $1.23 overhead resistance on December 2, and the bulls prevented the bears from pulling the price back below the breakout level. This indicates strong buying on dips.
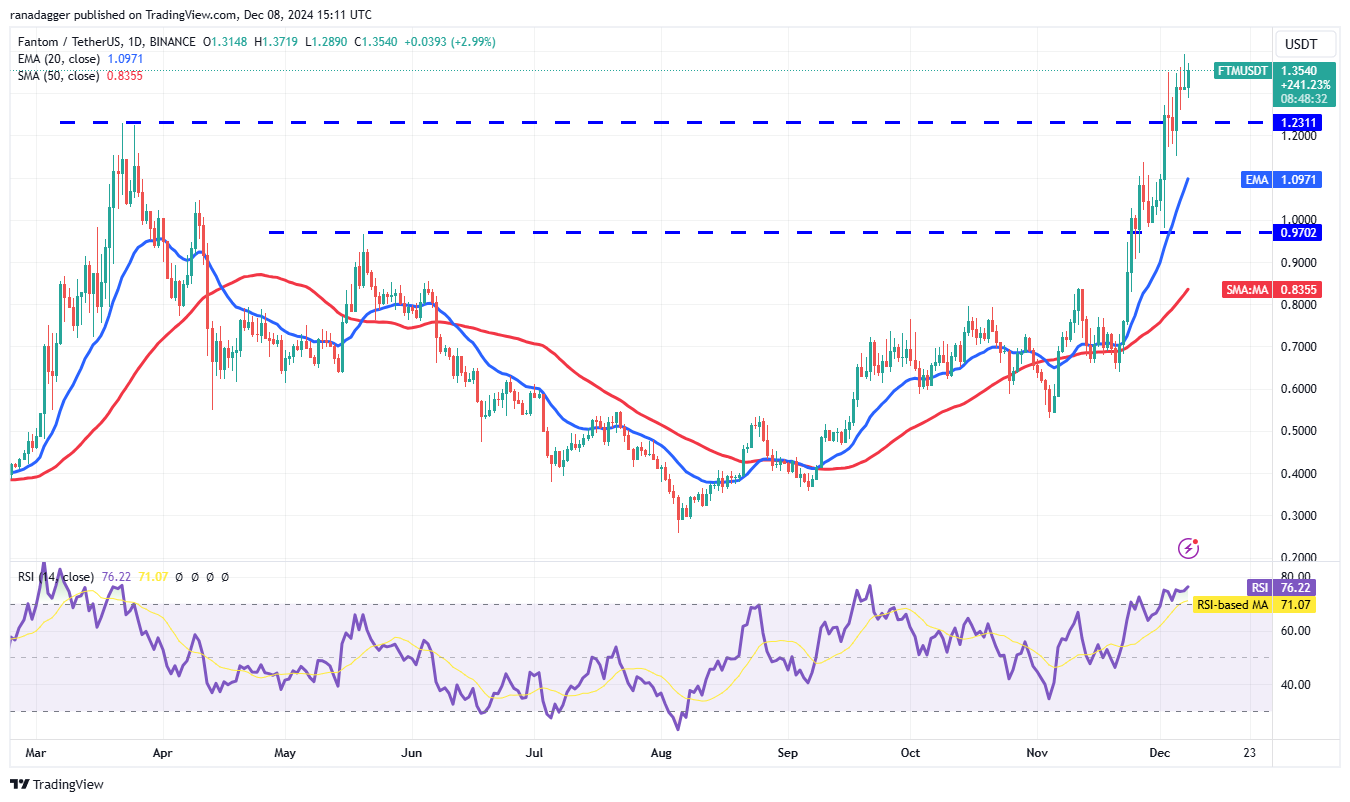
The rising 20-day EMA ($1.09) and the RSI in the overbought zone indicate that buyers have the upper hand. The bulls will try to push the price to $1.68, which is likely to act as strong resistance. However, if buyers can drive the price above $1.68, the rally could extend to $2.
The key support level to watch on the downside is $1.23. A drop and close below this support would suggest that the bullish momentum is weakening. In that case, the FTM/USDT pair could pull back to the 20-day EMA.
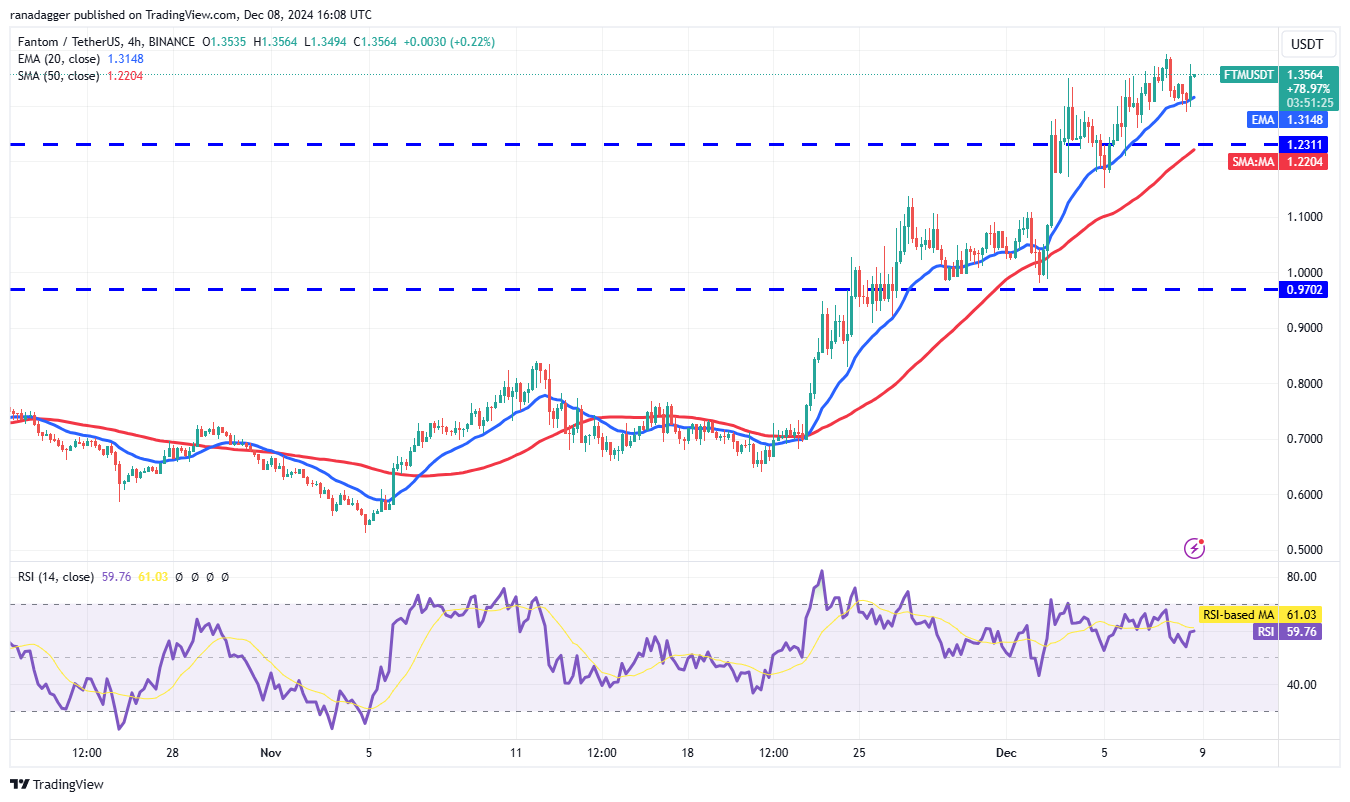
FTM/USDT 4 Hour Chart
The pair has bounced off the 20-EMA, indicating strong buying on every minor dip. If buyers can push the price above $1.39, the pair could continue its uptrend toward the next target at $1.68.
On the other hand, if the price reverses sharply from $1.39 and drops below the 20-EMA, it will show that the bears are active at higher levels. The pair may then slide to the 50-SMA. A drop below the 50-SMA could shift the short-term advantage in favor of the bears.
You can freely share your thoughts and comments about the topic in the comment section. Additionally, don’t forget to follow us on our Telegram, YouTube, and Twitter channels for the latest news and updates.


