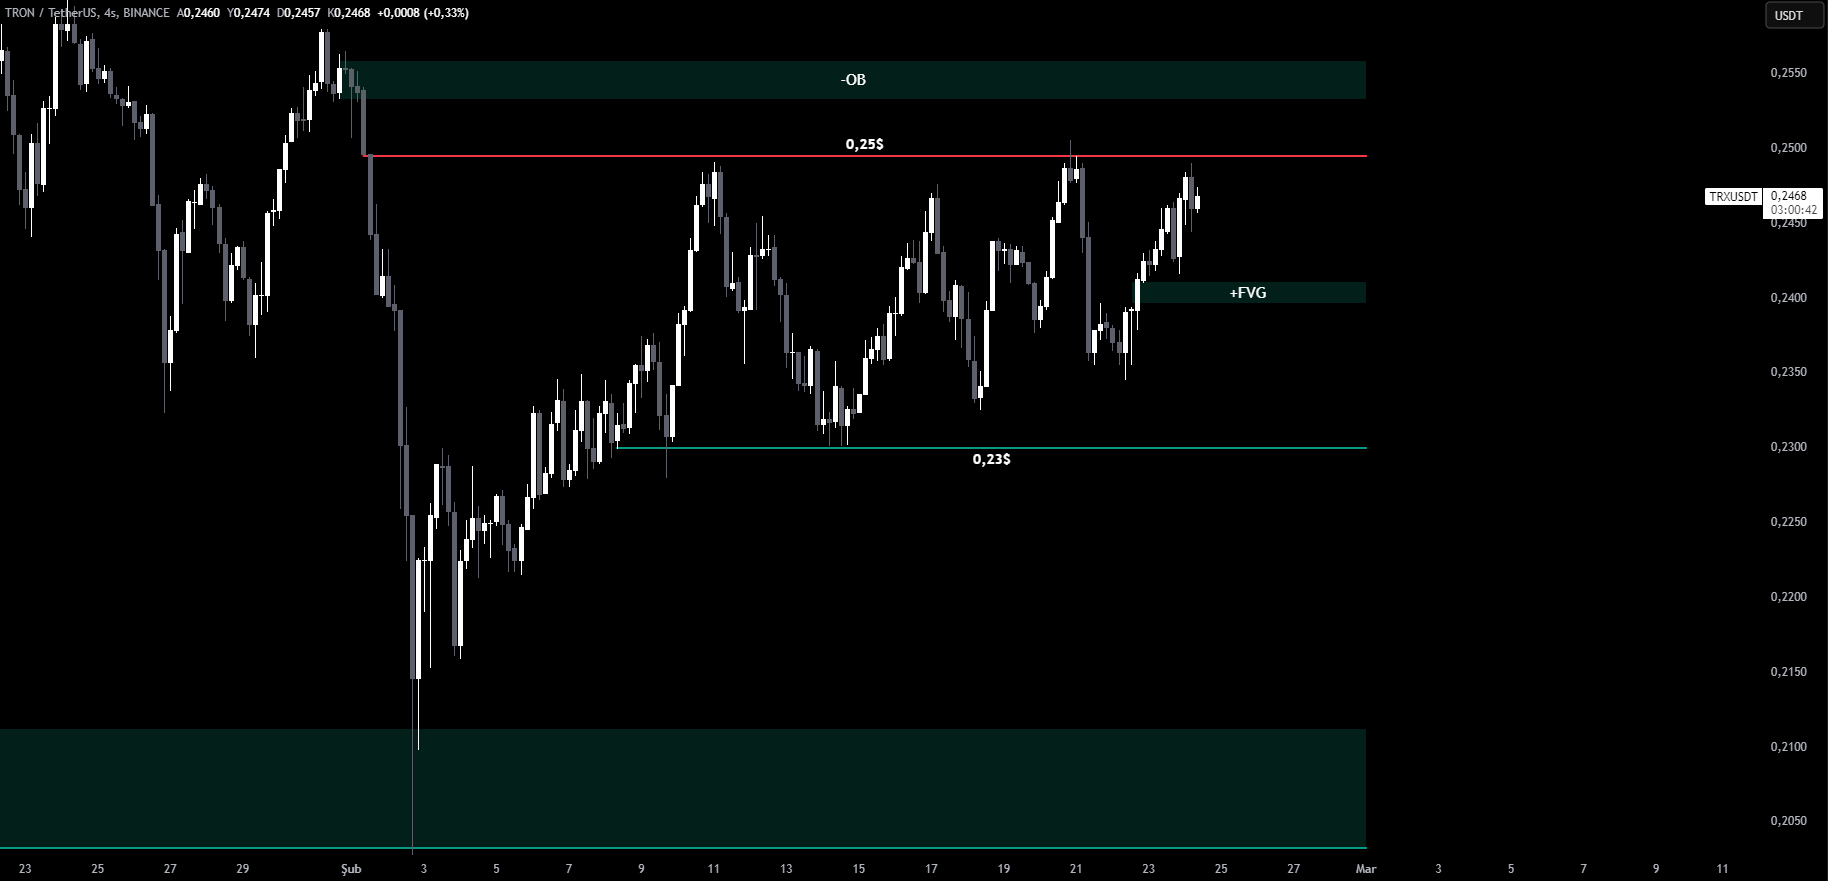
The TRX/USDT pair is showing quite a horizontal movement on the 4-hour chart. This suggests that the price is consolidating within a range, possibly preparing for a larger move. Currently, the $0.25 level can be seen as the first resistance point for the pair’s potential upward movement. If the price manages to break through this level, the next resistance will be at the order block region above. This area could act as a critical barrier for the pair’s continued rise.
You Might Be Interested In: Elon Musk Talks About the Name of a New Memecoin!
On the other hand, in the event of a potential downtrend, the FVG (fair value gap) region could be considered as the first support level. If the price falls below this region, a pullback towards $0.23 could be expected. These levels are crucial for TRX/USDT investors, providing key decision points. Traders can shape their strategies by closely monitoring how the price reacts to these levels.

These critical levels present opportunities for investors to evaluate potential price movements and make informed decisions.
You can also freely share your thoughts and comments about the topic in the comment section. Additionally, don’t forget to follow us on our Telegram, YouTube, and Twitter channels for the latest news and updates.


