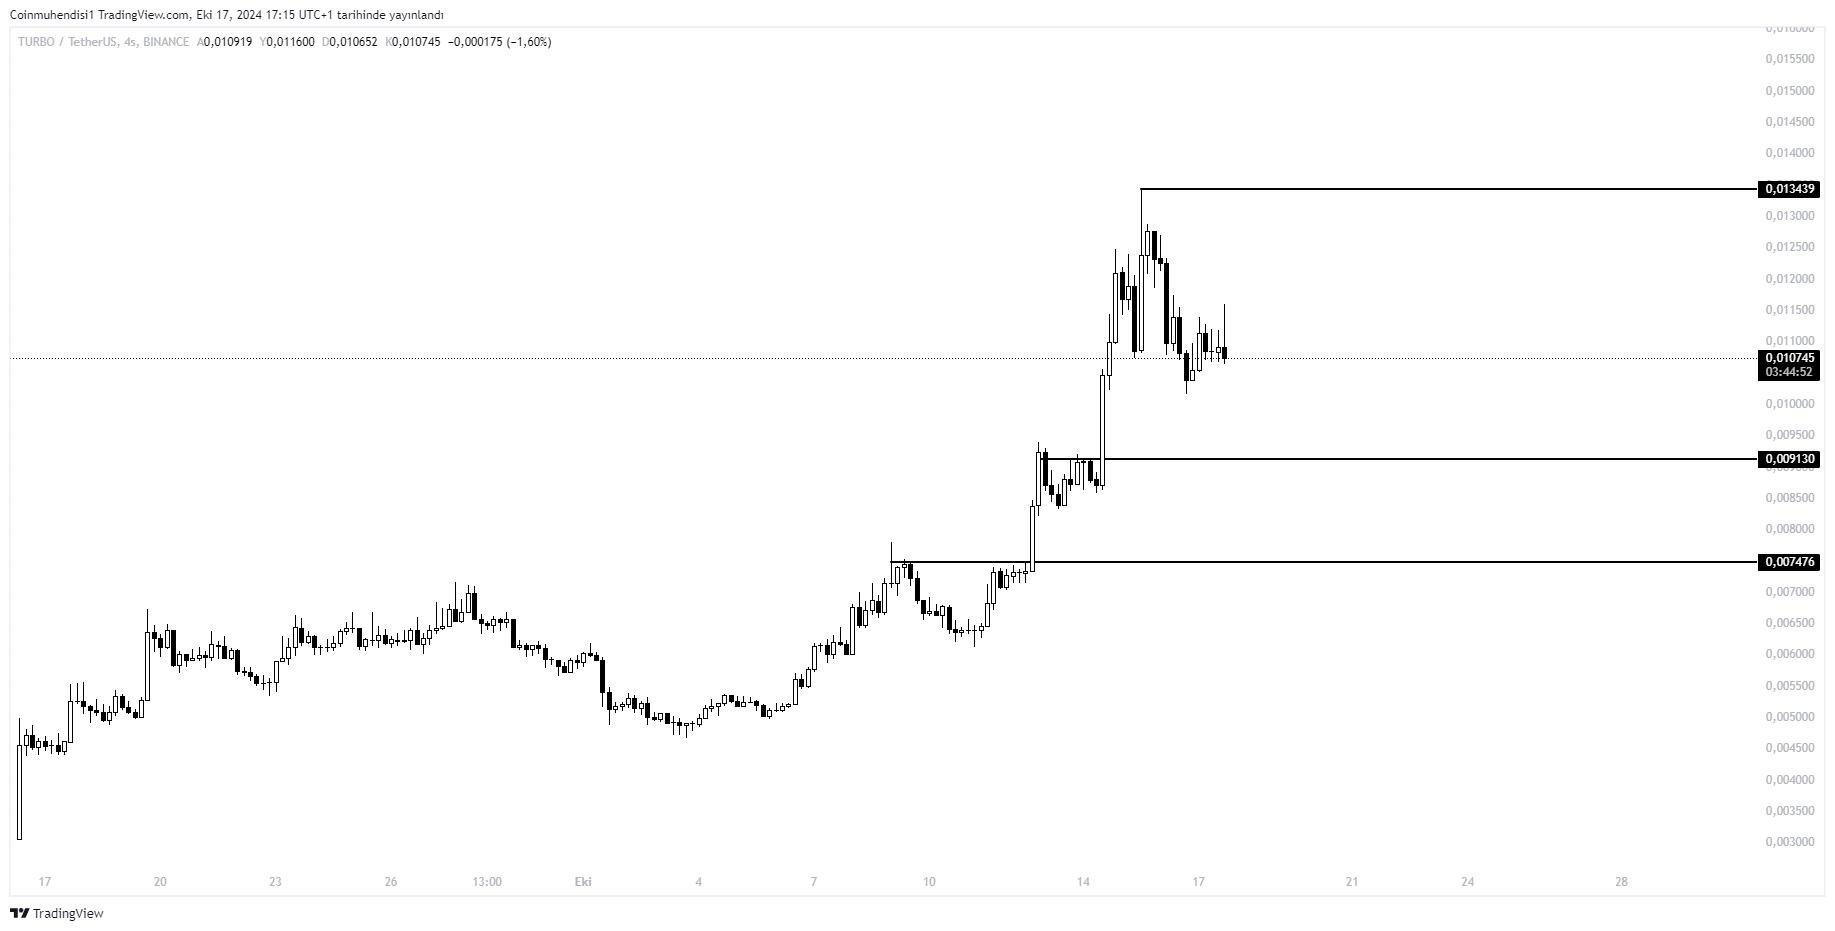
TURBO, one of the recent trending projects, has experienced a significant rise and hype, which continues to build momentum. The coin’s listings are also ongoing, with the latest being listed on Coinbase Futures. So, what could be the future scenarios for this coin? Let’s analyze it through the chart.

Firstly, we observe that a correction has started on the TURBO side. For a project that has increased 35x in a short time, such corrections are expected. Currently, there are two key correction zones on the chart. The first is the 0.0091 level, which is our initial support zone. If TURBO loses this level, a move toward 0.0074 could follow. Therefore, it’s crucial to closely monitor these levels on the chart.
For the upward movement, we need a close above the previous high. This means that we need to see closes above the 0.013 level for the bullish trend to continue.
You can also freely share your thoughts and comments about the topic in the comment section. Additionally, don’t forget to follow us on our Telegram, YouTube, and Twitter channels for the latest news and updates.


