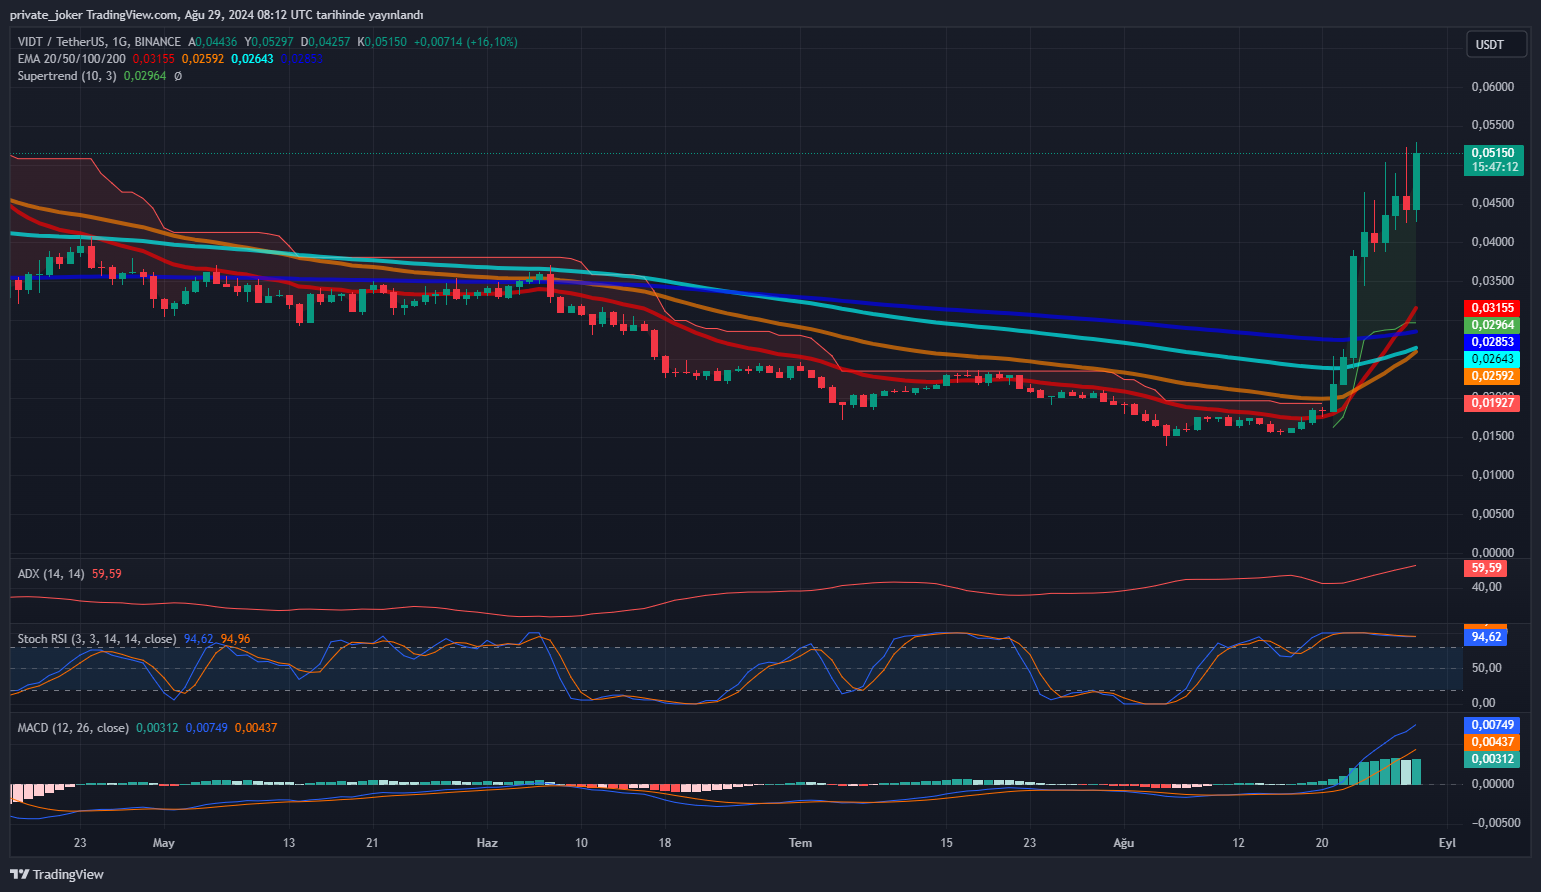
With a notable price rise of 126.40%, VIDT DAO (VIDT) has demonstrated amazing strength on the market this past week. This performance not only beats the wider bitcoin market, which dropped 1.80%, but even the gains of like Ethereum Ecosystem coins, which have surged by 12.70%. Currently trading with a market capitalization of $43,493, VIDT is #663 on CoinGecko.
The current daily trading volume of VIDT DAO is $26,564,782, reflecting an 8.30% increase from the previous day, which signals growing interest and activity in the token.
Technical Indicators: Strong Buy
The technical indicators for VIDT DAO point to a strong buy signal. Here’s a breakdown of the key indicators:
- Relative Strength Index (RSI): At 68.263, the RSI is in a buy zone, indicating that the asset is nearing overbought territory but still has room to grow.
- Stochastic Oscillator (STOCH): At 34.655, the stochastic oscillator suggests a sell signal, but this could be a short-term pullback in an otherwise bullish trend.
- Stochastic RSI (STOCHRSI): The STOCHRSI is at 100, indicating an overbought condition. While this might suggest caution, it is also a sign of strong bullish momentum.
- Moving Average Convergence Divergence (MACD): The MACD at 0.001 is in a buy zone, supporting the overall bullish sentiment.
- Average Directional Index (ADX): The ADX stands at 34.55, indicating a neutral trend but with potential for strengthening in either direction.
- Williams %R: At -2.283, this indicator is overbought, reinforcing the strong bullish sentiment.
- Commodity Channel Index (CCI): With a value of 226.5204, the CCI is overbought, which could suggest a potential price correction, but the overall trend remains positive.
- Average True Range (ATR): The ATR at 0.0068 indicates less volatility, suggesting that the price movements might be steady and controlled.
- Ultimate Oscillator: At 67.039, this indicator is in a buy zone, supporting the continuation of the bullish trend.
- Rate of Change (ROC): The ROC at 59.895 shows a strong positive momentum, indicating a rapid price increase.
- Bull/Bear Power: At 0.0318, this metric is also in a buy zone, further solidifying the bullish outlook.

Moving Averages: A Clear Uptrend
With both simple and exponential moving averages (SMA and EMA) throughout many time periods (MA5, MA10, MA20, MA50, MA100, and MA200), all moving averages for VIDT DAO exhibit a strong buy signal. This consistency across several moving averages supports the general positive attitude and implies that the present upswing could keep on.
Price Performance and Market Position
Recorded on November 23, 2022, VIDT DAO’s all-time high was $0.07288. The present pricing shows possible possibility for development since it is 28.70% less than this peak. But the present price, 274.98% higher than its all-time low of $0.01386, noted on August 5, 2024, shows a robust comeback and increasing momentum.
Assuming all tokens are in use, VIDT DAO’s completely diluted valuation (FDV) comes out to be $51,923,859. The FDV estimates that as more 840 million tokens become traded, there is still great room for expansion.
You can also freely share your thoughts and comments about the topic in the comment section. Additionally, don’t forget to follow us on our Telegram, YouTube, and Twitter channels for the latest news and updates.


