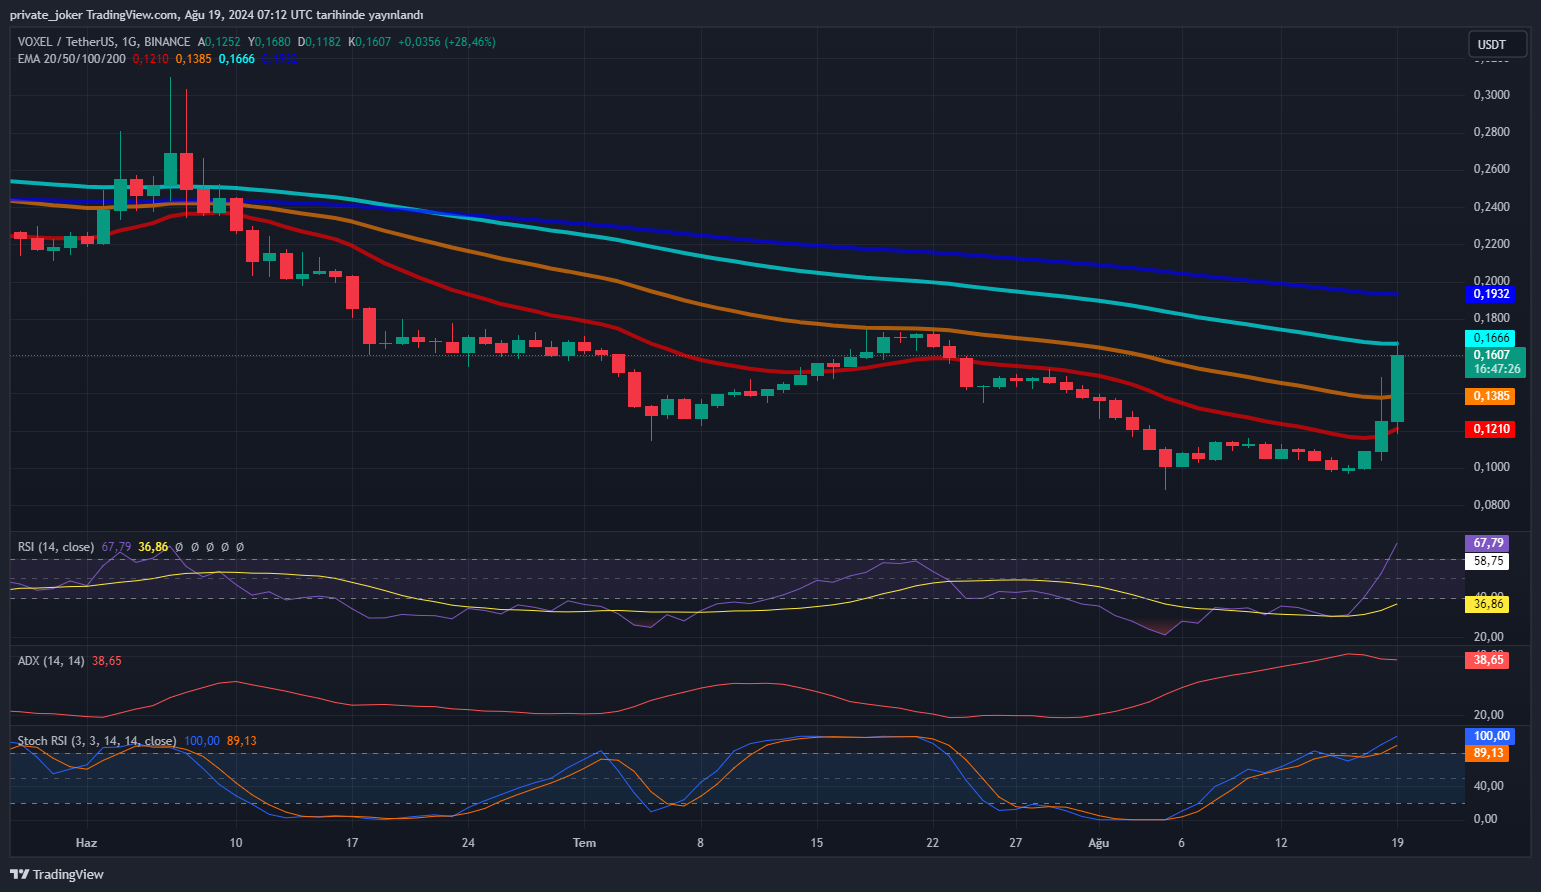
Voxies (VOXEL) has been making headlines recently due to its significant price movements and increased market activity. As a part of the growing Polygon Ecosystem, Voxies has garnered attention from traders and investors alike. This analysis delves into the current market status of VOXEL, examining its market capitalization, trading volume, all-time highs and lows, and the technical indicators that are shaping its price action.
Market Capitalization and Trading Volume
Ranked #771 on CoinGecko, Voxies (VOXEL) has a market capitalization of $28,622,957 as of the most recent figures. Multiplying the token’s present value with its circulating supply of 187,925,670 VOXEL tokens determines the market cap. With this somewhat low market valuation, VOXEL stands as a small yet significant participant in the bitcoin space.
VOXEL’s 24-hour trading volume, at $43,279,894, is among the most remarkable features of their most recent performance. Significantly rising from the previous day, this number shows a 917.50% increase in market activity and token demand. Such a sudden increase in trading volume usually points to increased investor interest, maybe motivated by technical breakout patterns, favorable news, or market speculation.
All-Time Highs and Lows
On December 16, 2021, VOXEL peaked at $4.70, an all-time high. The cryptocurrency has seen major price adjustments since then; its present value is 96.84% below its high. This sharp drop captures the general direction of the market as well as the difficulties many cryptocurrencies have keeping their value amid market turbulence.
Conversely, VOXEL’s all-time low, reached lately on August 5, 2024, at $0.0891, was recently With 66.84% more than this low, the token’s present price points to a robust comeback and maybe an optimistic market attitude. This comeback could be a sign of revived interest in VOXEL, maybe motivated by events inside the Polygon network or the Voxys ecosystem.
Fully Diluted Valuation (FDV)
VOXEL has a fully diluted valuation (FDV) of $45,692,997. Assuming the maximum supply of 600 million VOXEL tokens in circulation, FDV reflects the market cap. FDV is a theoretical figure depending on the token emission schedule; hence, it is important to realize. The whole supply might not be in use for years; hence, the current market cap could stay below FDV for a long time.

Technical Indicators
When analyzing VOXEL’s price action, the technical indicators provide valuable insights into its potential future movements. The summary of these indicators currently suggests a “Strong Buy” signal, with 7 indicators showing a buy signal, 1 neutral, and 2 sell.
- RSI (14): The Relative Strength Index (RSI) is at 74.861, indicating a buy signal. However, this value is approaching overbought territory, suggesting that while momentum is currently positive, caution may be warranted.
- STOCH (9,6) and STOCHRSI (14): The Stochastic Oscillator and Stochastic RSI show mixed signals, with the former indicating a sell and the latter an overbought condition. This suggests that VOXEL might be overextended in the short term.
- MACD (12,26): The Moving Average Convergence Divergence (MACD) indicator shows a buy signal, which is generally seen as a positive indicator for momentum.
- ADX (14): The Average Directional Index (ADX) is at 25.052, which is neutral. This suggests that while there is some trend strength, it is not yet strong enough to confirm a sustained move.
- Williams %R and CCI (14): Both indicators show buy signals, reinforcing the idea that VOXEL might continue its upward trend in the short term.
- ATR (14): The Average True Range (ATR) suggests high volatility, which could lead to significant price swings in either direction.
Moving Averages
Moving averages are crucial for identifying the trend direction and potential support or resistance levels. VOXEL’s moving averages across different time frames (MA5, MA10, MA20, MA50, MA100, MA200) all suggest a “Strong Buy” signal, indicating that the overall trend is bullish.
The simple and exponential moving averages for VOXEL show that the token’s price is above its short, medium, and long-term averages. This typically indicates that the asset is in an uptrend and could continue to rise if the overall market conditions remain favorable.
Conclusion
With its skyrocketing trade volume and good technical indications, Voxies (VOXEL) is currently seeing a notable increase in market activity. Although the token has dropped significantly from its all-time high, its recent comeback points to possible future increases. Strong purchase indications from several technical indicators and moving averages help to confirm this positive view.
Still, traders should use caution, especially considering the great volatility shown by the ATR and the overbought circumstances advised by the RSI and STOCHRsI. Like any investment, VOXEL should be chosen depending on the possible risks and rewards taken into account.
You can also freely share your thoughts and comments about the topic in the comment section. Additionally, don’t forget to follow us on our Telegram, YouTube, and Twitter channels for the latest news and updates.


