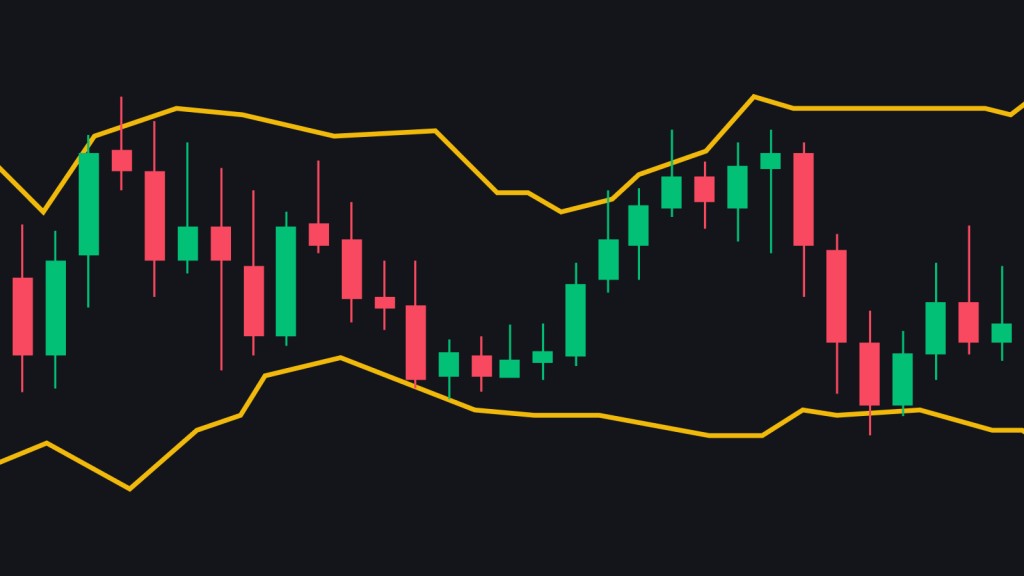
The Bollinger Band is a widely used indicator in technical analysis. Developed by John Bollinger in the early 1980s, it is effective in measuring price fluctuations and market volatility. In this article, we will detail what the Bollinger Band is, how it works, and how it can be used in investment strategies.
What is a Bollinger Band?
A Bollinger Band is an indicator used to analyze the price movements of a financial asset. It consists of three main components:
- Simple Moving Average (SMA): The middle band, usually calculated with a 20-day period.
- Upper Band: Created by adding one standard deviation to the middle band.
- Lower Band: Created by subtracting one standard deviation from the middle band.
These bands show how much the price fluctuates around the average level over a specific period. They are used to determine whether the price is high or low and to detect trend reversals.
How Does the Bollinger Band Work?
The Bollinger Band generates different signals depending on the price’s proximity to the bands:
- Approaching the Upper Band: When the price approaches the upper band, it may indicate that the asset is overbought, suggesting a possible correction.
- Approaching the Lower Band: When the price approaches the lower band, it may indicate that the asset is oversold, increasing the likelihood of a price rise.
- Band Expansion: An increase in the distance between the bands indicates rising market volatility.
- Band Contraction: When the bands narrow, it suggests low market volatility, which could signal an impending significant price movement.
Strategy Development
The Bollinger Band can be used as part of various investment strategies:
- Bollinger Squeeze: When the bands narrow, it is expected that the price will make a significant move. Investors may attempt to capture this movement.
- Trend Following: When the price moves above the upper band, it could signal a strong upward trend. A move below the lower band might indicate a strong downward trend.
- Support and Resistance: The middle band can be considered as support and resistance levels. A return to this band by the price can be evaluated as support or resistance.
Points to Consider
While the Bollinger Band is a powerful analysis tool, it should not be used in isolation. Combining it with other indicators can yield more reliable signals. Additionally, it’s essential to remember that the indicator may not always provide accurate results, as there is room for error depending on market dynamics.
You can also freely share your thoughts and comments about the topic in the comment section. Additionally, don’t forget to follow us on our Telegram, YouTube, and Twitter channels for the latest news and updates.


