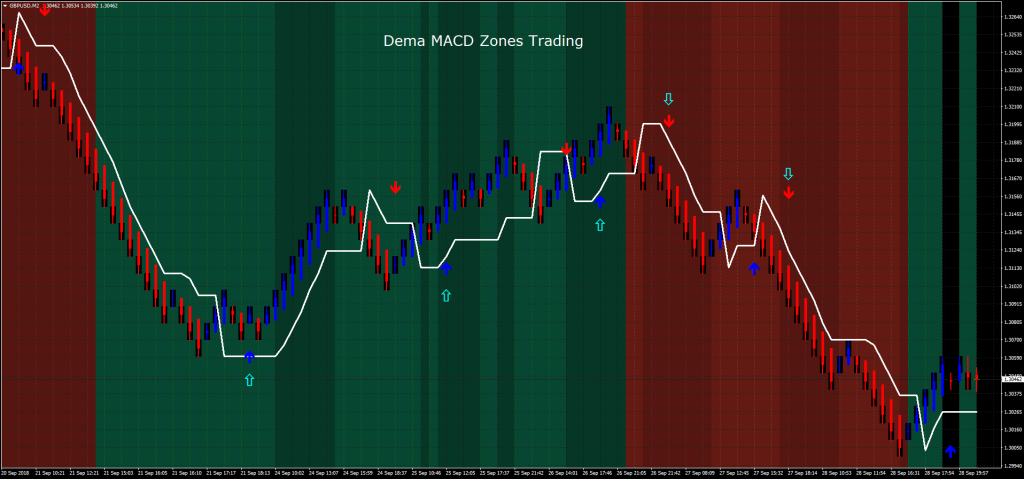
The MACD (Moving Average Convergence Divergence) and DEMA (Double Exponential Moving Average) indicators are widely used technical analysis tools in financial markets. The combination of these two powerful indicators provides investors with valuable insights into trend direction, momentum, and potential buy-sell signals. In this article, we’ll explore what MACD DEMA is, how it works, and how it can be utilized.
What is MACD?
MACD is a momentum indicator that measures the relationship between two different moving averages. It typically shows the difference between the 12-day exponential moving average (EMA) and the 26-day EMA. This difference is called the MACD line. Additionally, a 9-day EMA is used as a signal line and is plotted on top of the MACD line. Investors make buy-sell decisions based on the intersections of the MACD line with the signal line.
What is DEMA?
DEMA is a more responsive version of moving averages. It offers less lag compared to traditional moving averages and responds more quickly to price movements. This is particularly advantageous for short-term trading strategies. DEMA is created through a two-layered calculation: first, an EMA is calculated, and then another EMA is applied to this EMA, resulting in a faster-moving average.
How Does MACD DEMA Work?
This indicator is a faster and more sensitive version of the classic MACD. Here, DEMA is used in the calculations of both the MACD line and the signal line. As a result, the indicator is more responsive to market movements.
Using MACD DEMA:
- Crossover Signals: When the MACD line crosses above the signal line, it is considered a buy signal. Conversely, a downward crossover is seen as a sell signal. The use of DEMA allows these crossovers to occur more quickly.
- Zero Line Crossover: When the MACD line crosses above the zero line, it may indicate the beginning of an upward trend. A downward cross suggests a downward trend.
- Divergences: A divergence between price movement and the MACD line can signal a potential trend reversal.
This indicator offers investors the ability to analyze trends and momentum more quickly and accurately. Its greater sensitivity compared to the classic MACD indicator provides an edge, especially in volatile markets. However, like all indicators, it’s important to use MACD DEMA in conjunction with other technical analysis tools to achieve the best results.
You can also freely share your thoughts and comments about the topic in the comment section. Additionally, don’t forget to follow us on our Telegram, YouTube, and Twitter channels for the latest news and updates.


