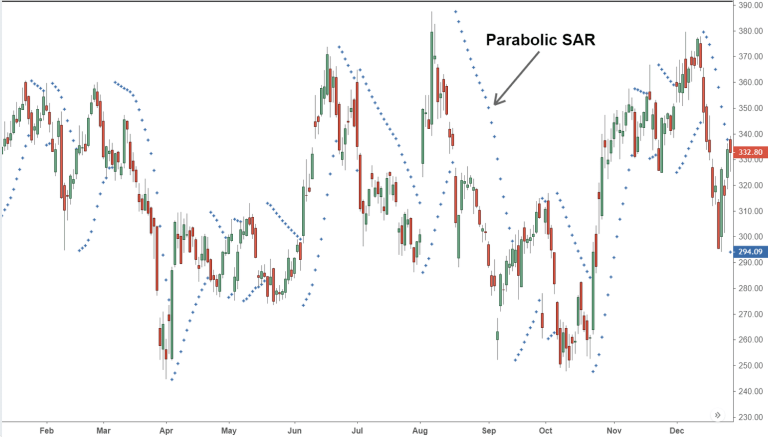
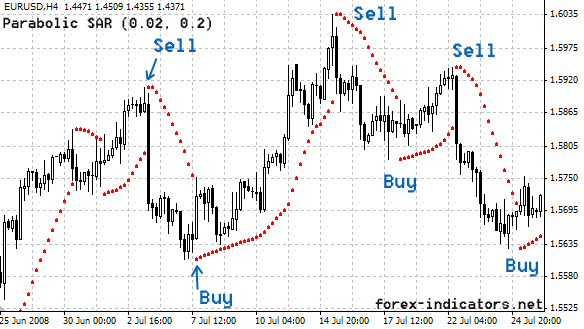
Parabolic SAR (Stop and Reverse) is an indicator used in technical analysis, specifically developed for trend following and identifying points where a trend may reverse. Introduced by J. Welles Wilder in 1978, this indicator helps investors and traders make decisions. The Parabolic SAR is particularly popular in trend-following strategies and generates buy and sell signals based on price movements.
What is Parabolic SAR?
Parabolic SAR stands for “Stop and Reverse.” This reflects the idea of closing a position and opening a new one in the opposite direction using the indicator. The Parabolic SAR is represented by dots on the price chart. These dots appear above or below the price, depending on the direction of the trend:
- When the Trend is Rising: SAR dots are below the price.
- When the Trend is Falling: SAR dots are above the price.
If the SAR dot intersects with the price, it may signal a trend reversal, prompting investors to consider reversing their positions.

Calculation of Parabolic SAR (For the Curious)
Calculating the Parabolic SAR can be somewhat complex, but understanding the basic principles is essential. The indicator is calculated by combining the highest and lowest prices of an asset with an acceleration factor (AF).
Basic Formula:
- For an Uptrend:
- SAR(T+1) = SAR(T) + AF × (EP – SAR(T))
- For a Downtrend:
- SAR(T+1) = SAR(T) – AF × (SAR(T) – EP)
Where:
- SAR(T+1): The SAR value for the next period.
- SAR(T): The SAR value for the current period.
- AF (Acceleration Factor): Starts at 0.02 and increases by 0.02 with each new high or low price, typically capped at 0.20.
- EP (Extreme Point): The highest price during an uptrend or the lowest price during a downtrend.
How to Use the Parabolic SAR Indicator?
The Parabolic SAR can be used in various ways to assist investors in making buy or sell decisions:
- Trend Following: The Parabolic SAR is used to determine whether a trend will continue or when it might reverse. When SAR dots are below the price, it could indicate an uptrend, and investors might consider buying. Conversely, when SAR dots are above the price, it could indicate a downtrend, and investors might consider selling.
- Setting Stop Loss Levels: The Parabolic SAR can be used as a dynamic stop loss level. The SAR dots provide an idea of how far the price might pull back, allowing investors to adjust their positions accordingly.
- Reversing Positions: The Parabolic SAR can be used to determine when to close an existing position and open a new one in the opposite direction. This strategy can be particularly useful in fast-moving market conditions.

Advantages and Disadvantages
Advantages:
- Ease of Use: The Parabolic SAR is easily visible and interpretable on the chart.
- Trend Following: It is an effective tool for determining the direction and strength of trends.
- Dynamic Stop Loss: It offers a dynamic stop loss level to help protect positions.
Disadvantages:
- False Signals: It may generate false signals during low volatility periods or in sideways markets.
- Lagging Signals: The indicator may provide lagging signals relative to the current trend, potentially causing missed opportunities.
- Susceptibility in Fast Market Conditions: During rapid price movements, the SAR may falsely indicate a trend reversal.
Combining with Other Indicators
It is common to combine the Parabolic SAR with other technical analysis indicators to reduce false signals and make more reliable trading decisions. For example:
- Moving Averages: Can be used alongside to confirm the strength of the trend.
- RSI (Relative Strength Index): Can be combined to see if the trend is in overbought or oversold conditions.
- MACD (Moving Average Convergence Divergence): Can be used to confirm or support the signals provided by the Parabolic SAR.
You can also freely share your thoughts and comments about the topic in the comment section. Additionally, don’t forget to follow us on our Telegram, YouTube, and Twitter channels for the latest news and updates.


