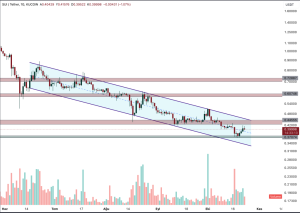
In this article, we will analyze the past price movements of SUI through price analysis, charts, and technical indicators. We will identify support and resistance levels and guide investors in their buying and selling decisions.
When we closely examine the chart of Sui, we observe that it has been moving within a falling channel for approximately the last 129 days. When we analyze the channel movements of Sui, we see that it rarely tests the lower band and usually rallies towards the upper band of the falling channel after falling below the middle band. Therefore, it would not be wrong to say that the upper band of the channel is a significant resistance area and a region where sharp sales can take place.
You might like: Worldcoin Updates ORB Reward Plan to Increase WLD Supply.
An interesting situation regarding the upper band of the channel is that it underwent testing during the final week of each month. Therefore, we should consider that Sui can test the upper band of the channel again in the next week.
Sui Technical Analysis

When we evaluate the Sui project on the chart, after receiving a strong reaction with the support coming from the $0.37074 level, we observe that it has successfully overcome the middle band of the channel. If Sui can maintain the middle band of the channel as support, it may proceed towards the next resistance level of $0.44555. However, we consider this region to serve as both the upper band of the channel and as a formidable resistance area, so we should bear in mind that it will not yield easily. Also, due to Sui’s locked assets that will be opened on 3rd of November, it can create selling pressure.
Let’s consider another scenario: If Sui succeeds in overcoming the $0.44555 resistance and shows a clear break from the falling channel, we may see an upward trend in Sui. After these breakouts, we can start to talk about a target of around $0.60. In this scenario, it can offer a rise potential of approximately 50% from where we are now.


