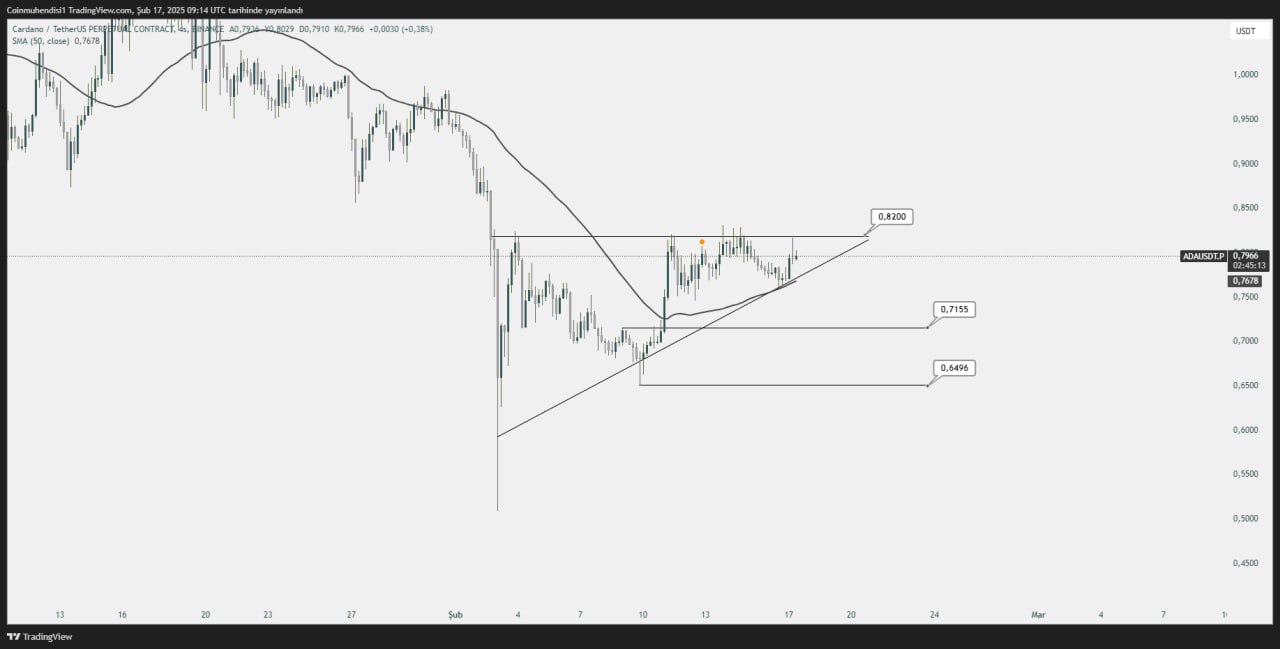
What are the support and resistance levels in Cardano (ADA) Coin? What does the chart show? We have prepared the latest analysis of Cardano (ADA) Coin for you.
Cardano (ADA) Price Analysis
A narrowing triangle formation has formed on the ADA side, and the chart currently appears to be quite low in volume. Looking at the price movements, we observe that volatility remains low, and a significant portion of the buy-sell transactions are being carried out by bots. This indicates that the market is in a phase of direction determination and that a strong buyer base has yet to step in.

The key resistance level currently stands at 0.82. Unless this level is broken, it seems difficult for the upward momentum to gain strength. On the other hand, if a breakout occurs to the upside, we may see an increase in buying pressure in the short term. However, support zones should also be closely monitored. The 0.71 and 0.64 levels are important liquidity zones, and if the price reaches these levels, potential rebound purchases may occur. A drop below these levels, however, could increase selling pressure, pushing ADA to test lower price levels.
Given the current market structure, ADA’s price is trapped within the narrowing triangle formation, requiring higher-volume transactions for a clear trend direction. Depending on the breakout direction, the market’s reaction to support or resistance levels should be carefully observed.
This analysis does not constitute investment advice. Cryptocurrency markets involve high risks, and it is important to conduct your own research before making investment decisions.
You can freely share your thoughts and comments about the topic in the comment section. Additionally, don’t forget to follow us on our Telegram ,YouTube and Twitter channels for the latest news and updates.


