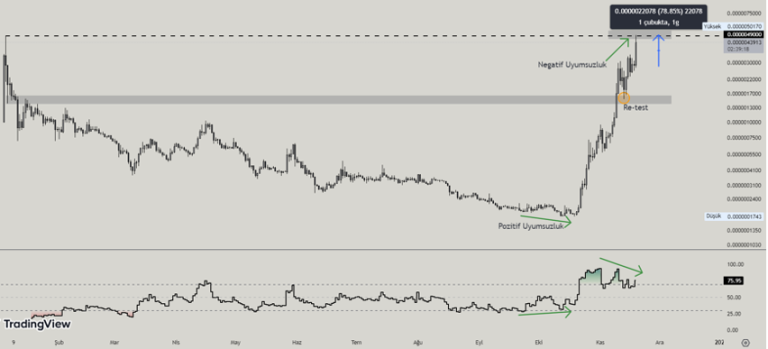
Bonk Token, which saw its all-time highest price with an increase of about 75% on November 19, 2023, made its investors smile. It has experienced a more than 50% increase in value in the last 12 hours. The current price was recorded as $0.000004327.
You might like: What Are Meme Coins? Why Are They Rise?
The Interest in Meme Coins Is Still Continuing!
Are meme coins, which have started to sit on the agenda again in recent months with their volumes and the increases they have made, getting active again? Bonk has managed to gain about 770% in value in the last month, along with the rise of Bitcoin.

Bonk, which has been continuing its downward trend for months, broke the market structure in October and started its upward movement. The positive mismatch that occurred in the RSI was a harbinger that the rise would begin.
With the beginning of the rally of Bitcoin, it has made a new ATH by breaking the resistance that came in front of the price, even the old ATH point. The correction movement made by the price in the orange marked area was an opportunity to re-enter the game.
The price’s Fibonacci correction level of 0.000005080, which is the 1.618 level, seems to be a good point for profit-taking. The negative mismatch in the RSI indicates that the price may be heading for a correction in the near future.
Feel free to share your thoughts on the topic in the comments. Besides, don’t forget to follow us on Telegram, YouTube, and Twitter for more analysis and updates.


