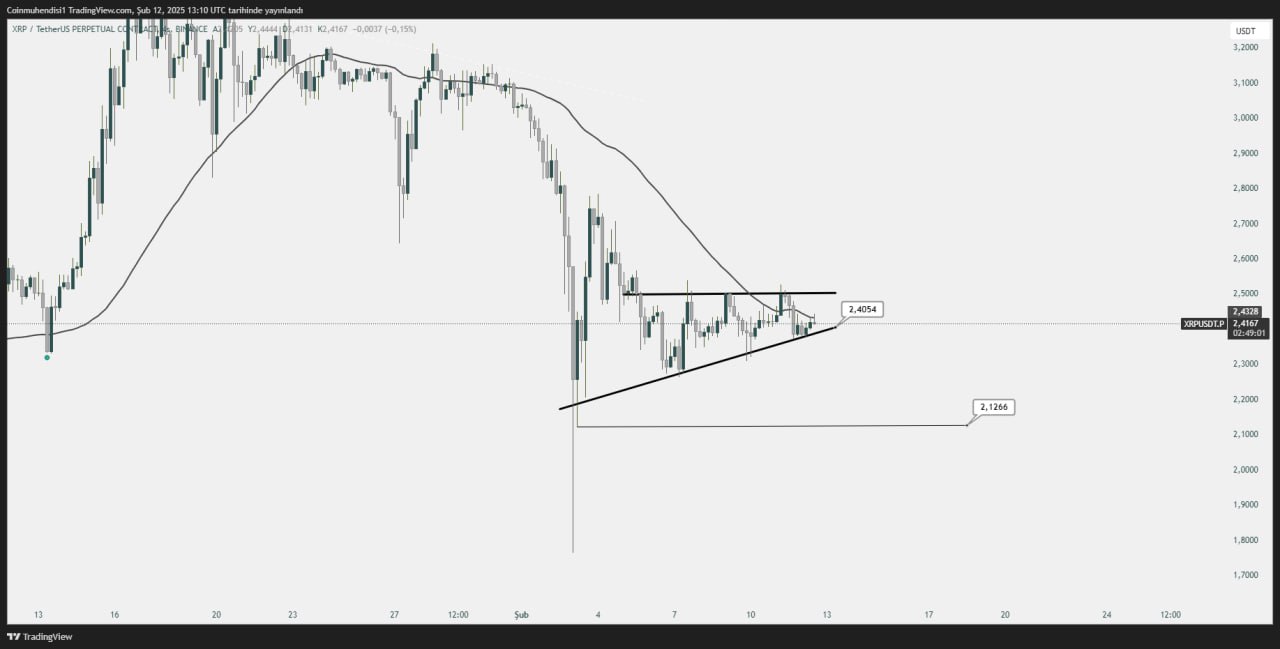
A negative pattern appears to be forming on the XRP price chart. This structure, known as a “rising wedge” in technical analysis, is generally considered as a pattern that increases the probability of a downside breakout. In the current situation, XRP is predicted to experience a deeper decline if it loses the $2.40 level.
While XRP has struggled to break through important resistance levels in recent days, it is noteworthy that the price is moving in a narrowing range. If XRP falls below the $2.40 level, the $2.12 level stands out as the next support area. This level has worked as an important demand zone in past price movements and investors can expect a reaction buy at this level.

However, markets are not driven by technical analysis alone. Economic data, especially from the US, has severely impacted XRP’s price action. Macroeconomic developments can have major repercussions for the cryptocurrency market. Factors such as inflation data, interest rates or statements from the US Federal Reserve (Fed) could determine the short-term direction of XRP.
On the other hand, XRP needs to break above the $2.50 level for a significant upside breakout. If this happens, the bullish scenario could come into play and the price could head towards the $2.80 level again.
In summary, whether XRP will lose the $2.40 support is a critical factor. Investors need to carefully monitor both technical levels and global economic developments.
You can also freely share your thoughts and comments about the topic in the comment section. Additionally, don’t forget to follow us on our Telegram, YouTube, and Twitter channels for the latest news and updates.


