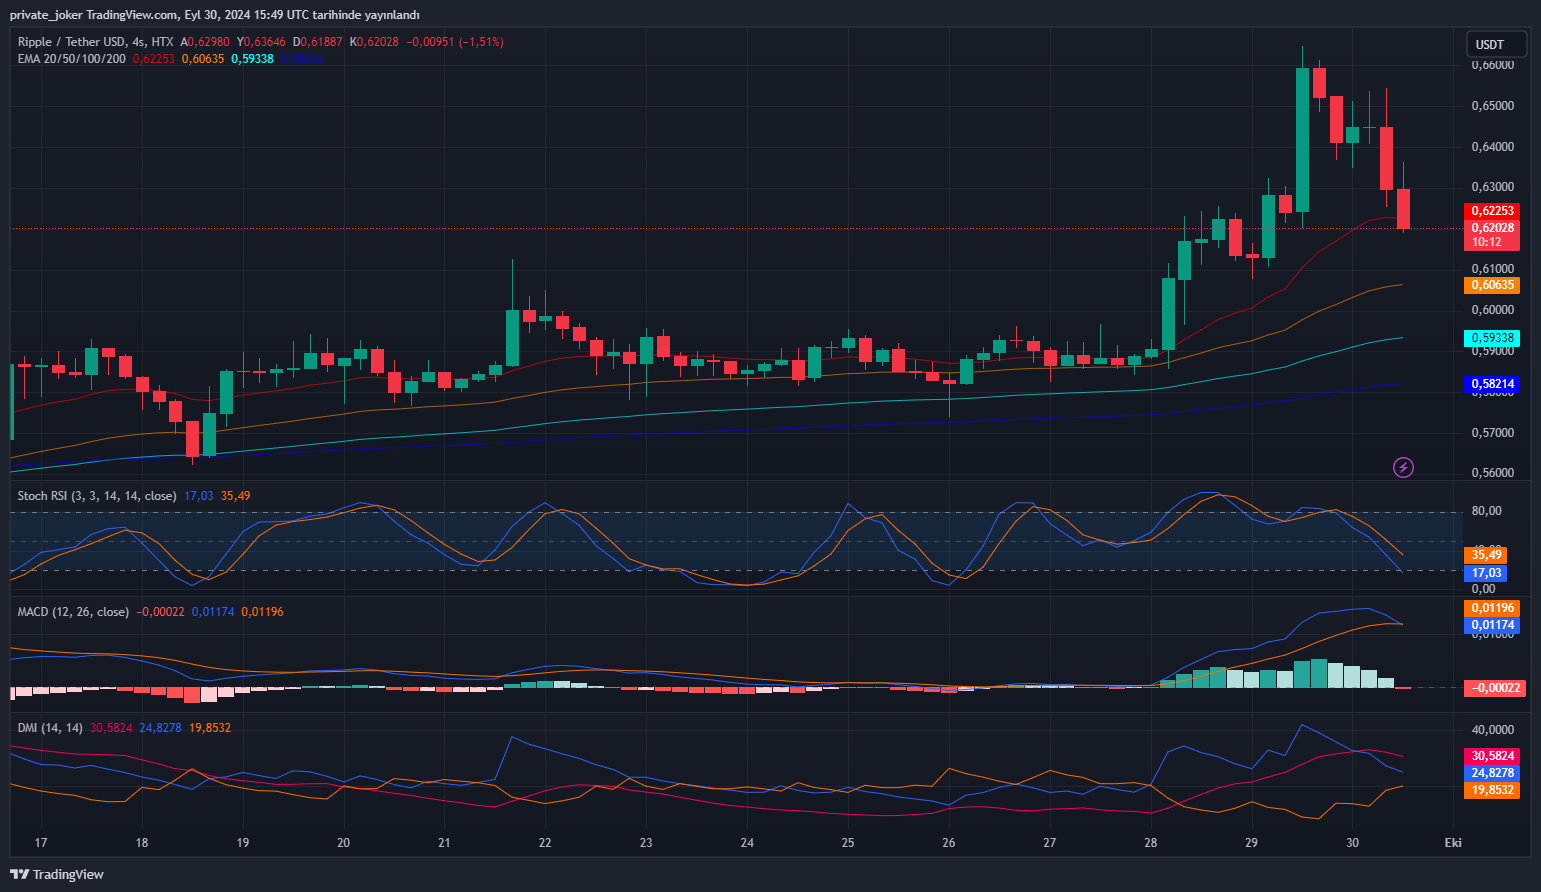
Rising almost 10%, XRP has clearly broken the $0.600 barrier level in price terms. With technical signs suggesting possible more upward movement, the bitcoin is currently consolidating gains close to $0.6450.
XRP Price Breaks $0.600 Resistance
Rising above the critical $0.600 resistance zone, XRP’s price spike is the result of the token gathering momentum and surpassing other cryptocurrencies, including Bitcoin and Ethereum. XRP bulls then showed great market purchasing interest by pushing the price past important resistance levels of $0.6120 and $0.6250.
XRP even momentarily passed the $0.650 resistance, peaked at $0.6642, then slightly dropped. Settling just above the $0.6250 level, the price tested the 50% Fibonacci retracement level of the upward advance from the $0.6082 swing low to the $0.6642 high.
Technical Analysis and Key Levels
On the hourly chart of the XRP/USD pair, XRP is presently trading above the $0.6250 level and the 100-hour Simple Moving Average; a significant contracting triangle forms resistance at $0.6500. Should the pair remove the $0.6500 and $0.6550 resistance levels, they could initiate a new rise.
Should XRP pass the $0.6550 level, it might target the $0.6640 barrier first, then the $0.6850 level. Additional increases might drive the price toward the $0.700 resistance or maybe as high as $0.720 in the short term.

Support Levels and Downside Risk
Should XRP fail to breach the $0.650 resistance zone, it can experience a negative reversal. First support falls close to the $0.6350 level; the next significant support is at $0.6285. With $0.600 being a key milestone to keep an eye on potential losses, a downward break below the $0.6285 level could see the price fall toward the $0.6120 support.
Technical Indicators
- MACD: The hourly MACD for XRP/USD is starting to lose pace in the bullish zone.
- RSI: The Relative Strength Index (RSI) for XRP/USD is currently above the 50 level, indicating bullish momentum.
- Major Support Levels: $0.6350 and $0.6285.
- Major Resistance Levels: $0.6500 and $0.6550.
With critical resistance levels of $0.6500 and $0.6550 in sight, XRP’s recent climb above $0.600 has inspired hope among traders. Should the price pass these thresholds, it might start toward $0.700 or more. But should it lose its upward pace, the $0.6285 and $0.600 support levels would be absolutely vital in stopping more falls.
You can also freely share your thoughts and comments about the topic in the comment section. Additionally, don’t forget to follow us on our Telegram, YouTube, and Twitter channels for the latest news and updates.


