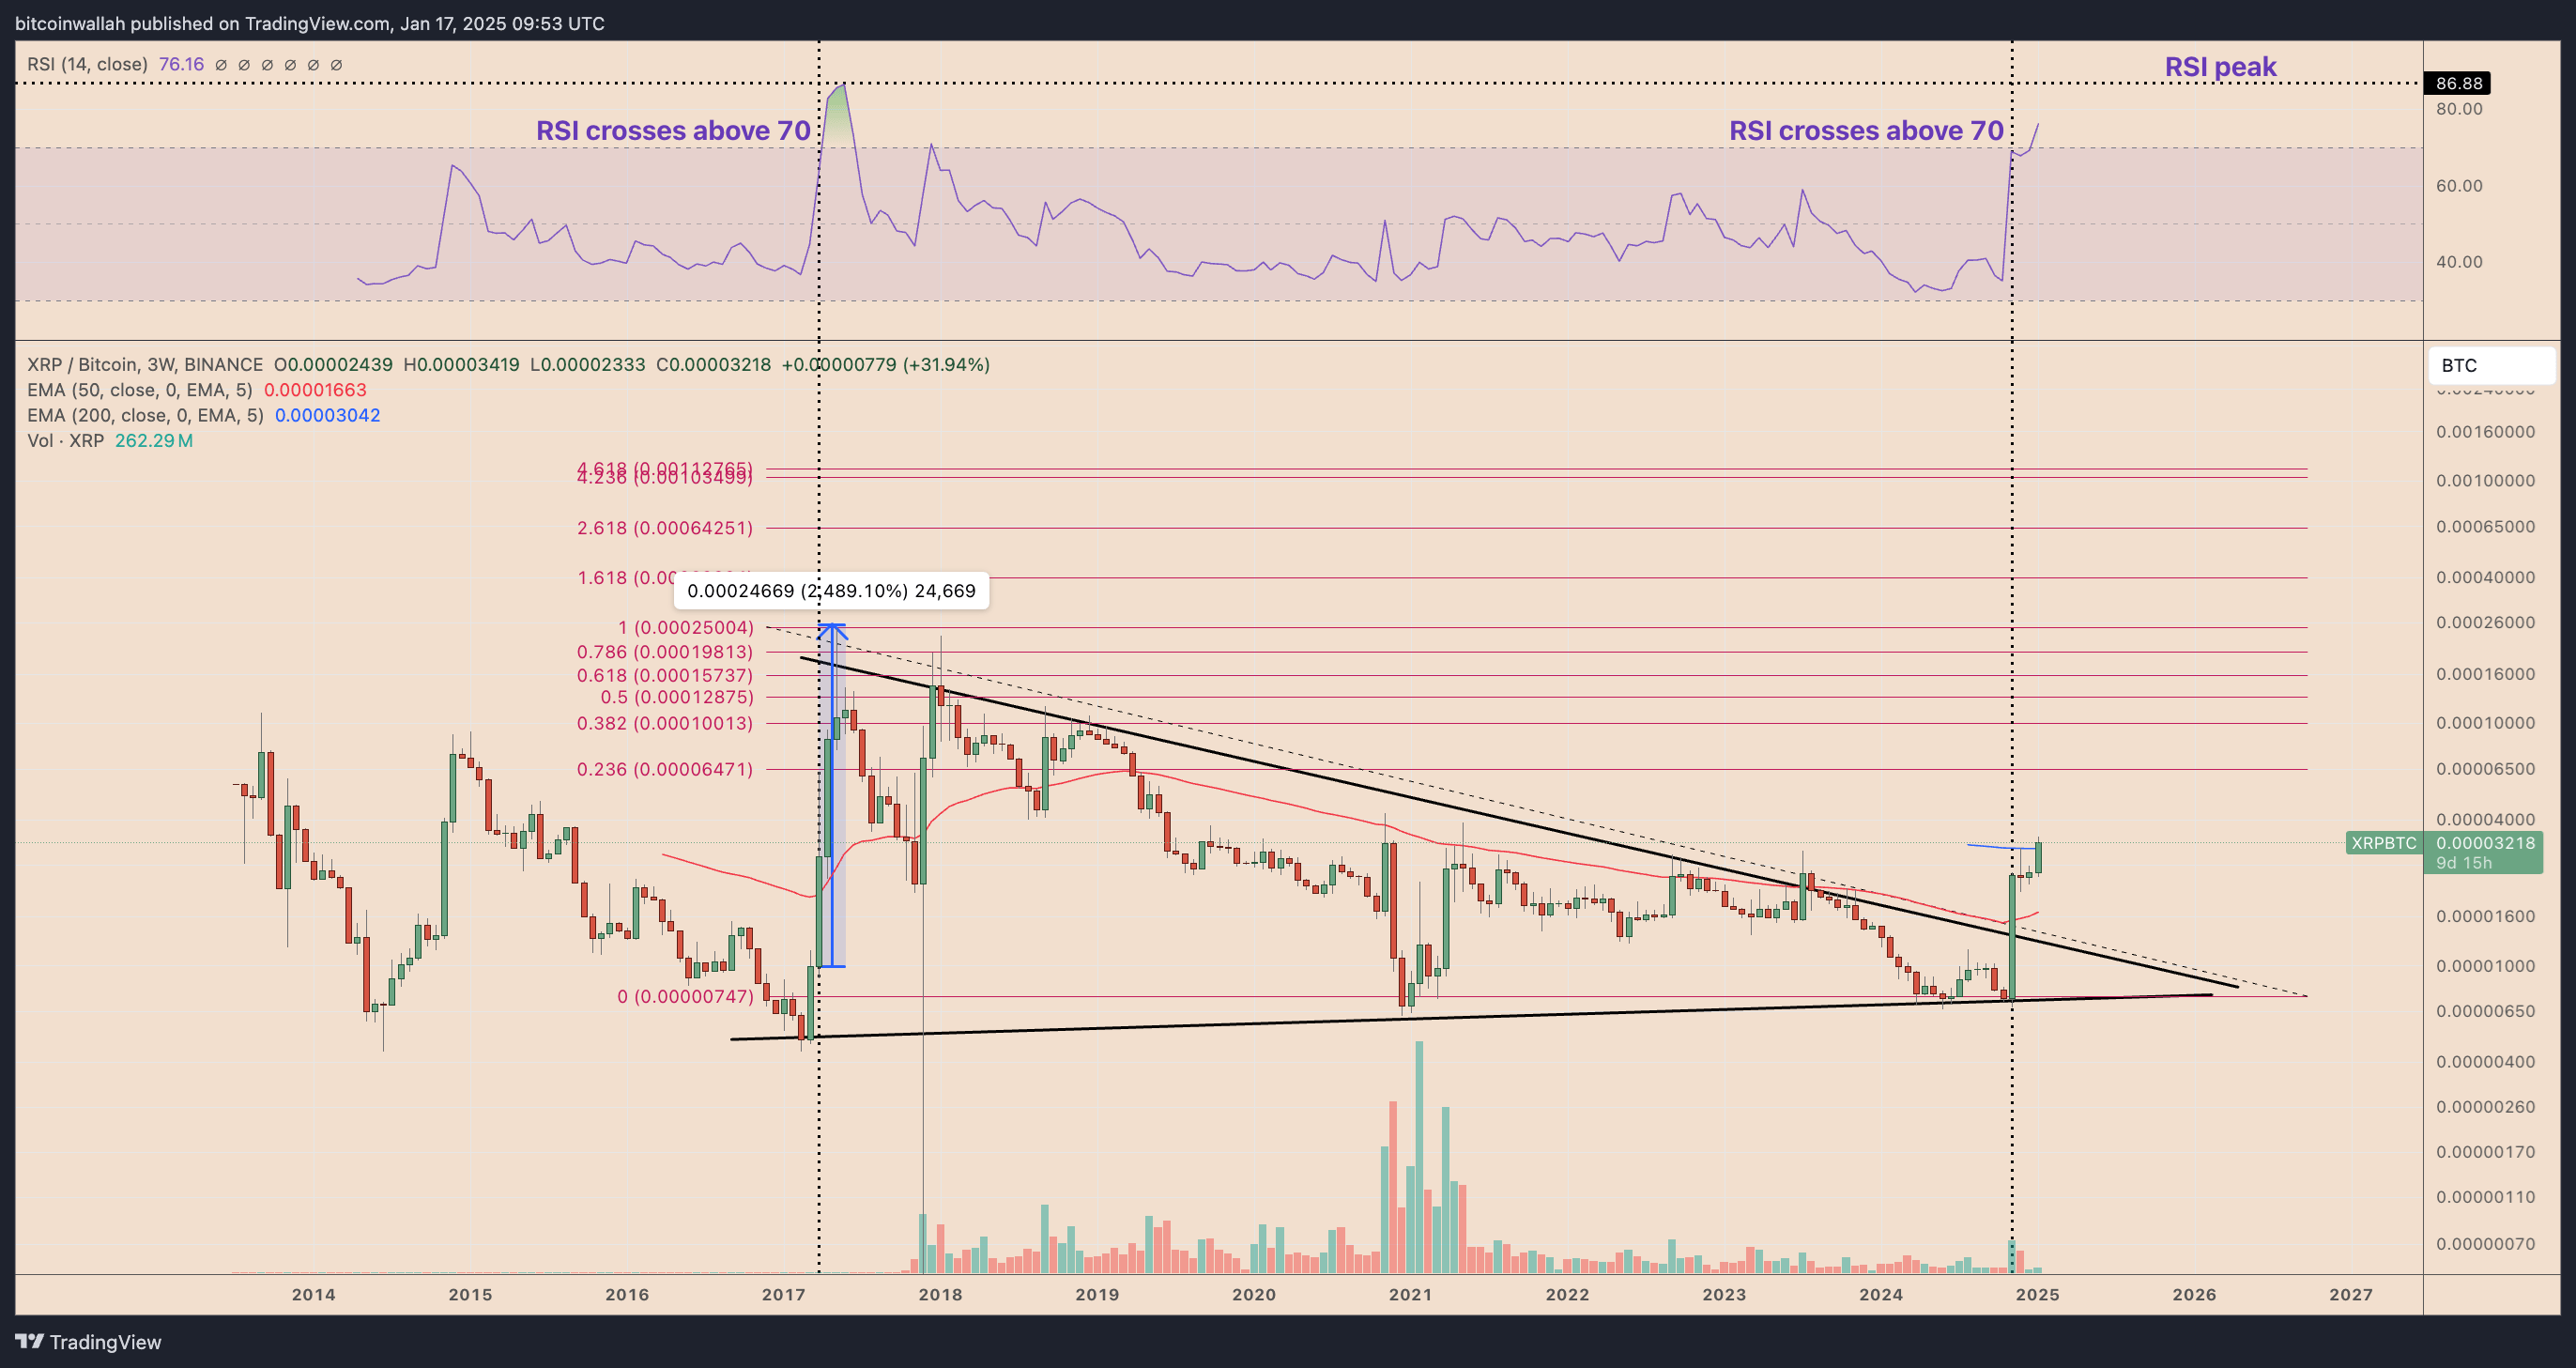
XRP’s price action in 2025 resembles the 2,500% price surge at the beginning of 2017, when it broke its 8-year downtrend.
XRP has surged by over 350% against Bitcoin since Donald Trump’s US presidential election win in November. The XRP/BTC pair shows striking similarities to the 2017 bull market, suggesting a potential explosive rally in the coming months if this fractal plays out again. Additionally, technical indicators and emerging fundamentals hint at the possibility of the pair doubling in value by March.
XRP Price Up 32% vs Bitcoin in January
XRP/BTC is up nearly 32% in January 2025, breaking above key resistance levels and entering the overbought zone, based on the Relative Strength Index (RSI). The last time XRP/BTC witnessed such RSI levels was in early 2017, just before a 2,500% rally.

XRP/BTC Three Week Chart
RSI exceeding 70 typically precedes a period of market consolidation or correction. However, in some cases, strong market fundamentals can push prices even higher.
In 2017, RSI climbed above the overbought threshold of 70, but it did not immediately result in consolidation or correction. The overall euphoria triggered by the initial coin offering (ICO) boom helped XRP sustain its 2,500% surge against Bitcoin.
XRP’s Movements in 2025 Could Repeat 2017
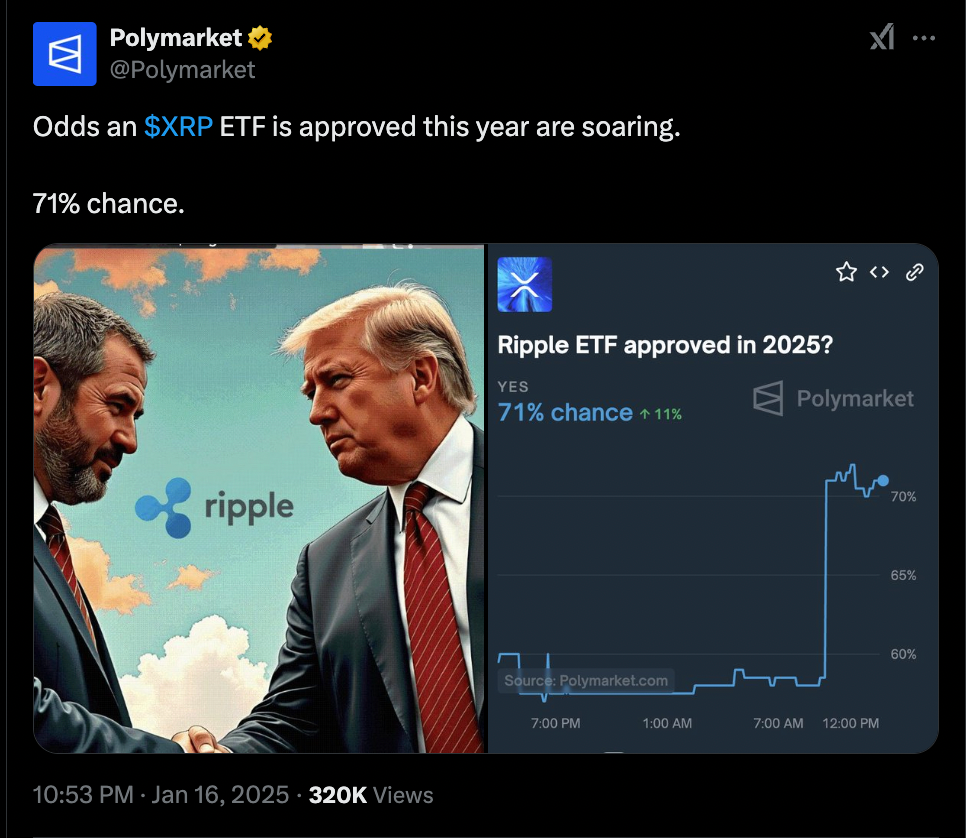
In 2025, although the fundamentals are slightly different, they remain favorable for XRP. For example, the resolution of the ongoing SEC vs. Ripple lawsuit under the Trump administration could pave the way for the approval and launch of XRP exchange-traded funds (ETFs) in the US.
JPMorgan analysts predict these ETFs could bring in capital inflows between $4 billion and $8 billion. Meanwhile, Ripple announced the launch of RLUSD, a stablecoin aimed at boosting liquidity within the XRPL ecosystem, which further benefits XRP.

These strong fundamentals could pave the way for XRP/BTC to continue its rally in the coming weeks, even if it enters an “overbought” condition.
XRP Price Technicals Hint at 100% Gains
In this bullish scenario, the next upward target is likely to be the 0.236 Fibonacci retracement level, which corresponds to the 6,471 satoshi level (1 satoshi = 0.00000001 BTC). This represents an approximate 100% increase when measured from current price levels.
XRP/BTC has also broken out of its prevailing 8-year symmetrical triangle pattern to the upside, reinforcing the bullish outlook presented by its 2017 fractal and accompanying fundamentals.
On the other hand, if XRP fails to break above its current resistance area, defined by the 1,950-3,550 satoshi range in the chart above (marked in red), it could invalidate the bullish setup discussed above.
Also, in the comment section, you can freely share your comments and opinions about the topic. Additionally, don’t forget to follow us on Telegram, YouTube and Twitter for the latest news and updates.


