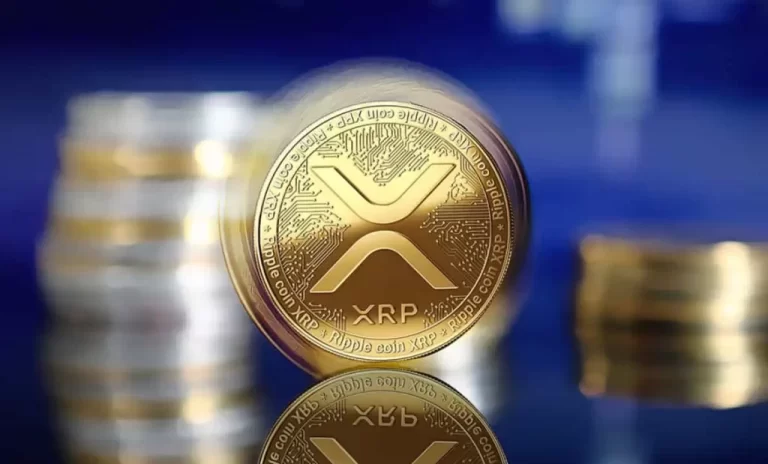
Now hovering around $0,5634, XRP’s price is averaged around $0,56. The technical indicators suggest a likely reversal of the trend suggesting that perhaps the pace of its rise might be like the more than 50,000% it experienced in the past.
New research by crypto analyst Javon referred to as @JavonTM1 highlights that the current pattern of fluctuation of XRP is in tune with the performance of the token in the 2016 – 2017 period when the cryptocurrency ascended from below $0,0066 to above $3,30. While it is not possible to predict a similar kind of large scale event though the developing technical signals suggest a similar trajectory to the above one to be under action.
Often regarded as a signal of rising velocity, a distinct sign is the underlying bullish divergence that exists in XRP’s price trend, where higher lows in the price correspond to lower lows in the RSI. As already mentioned above before the sharp increase of XRP in 2017, this trend may be attributed to the fundamental value and may indicate a high possibility of an important level breakout.
XRP is now being supported around $0,5634 although there’s resistance around $0,60. Whereas, the MACD shows that negative momentum is decreasing with a gap that is widening, which points to a possible change in its trend, the RSI figure of 49,71 suggest a neutral stand for the market.
Especially when the MACD crosses which may in turn bring in a positive sentiment and a surge in price similar to what was seen in previous cycles, traders are closely waiting for an escape from the current consolidation range.
You can also freely share your thoughts and comments about the topic in the comment section. Additionally, don’t forget to follow us on our Telegram, YouTube, and Twitter channels for the latest news and updates.


