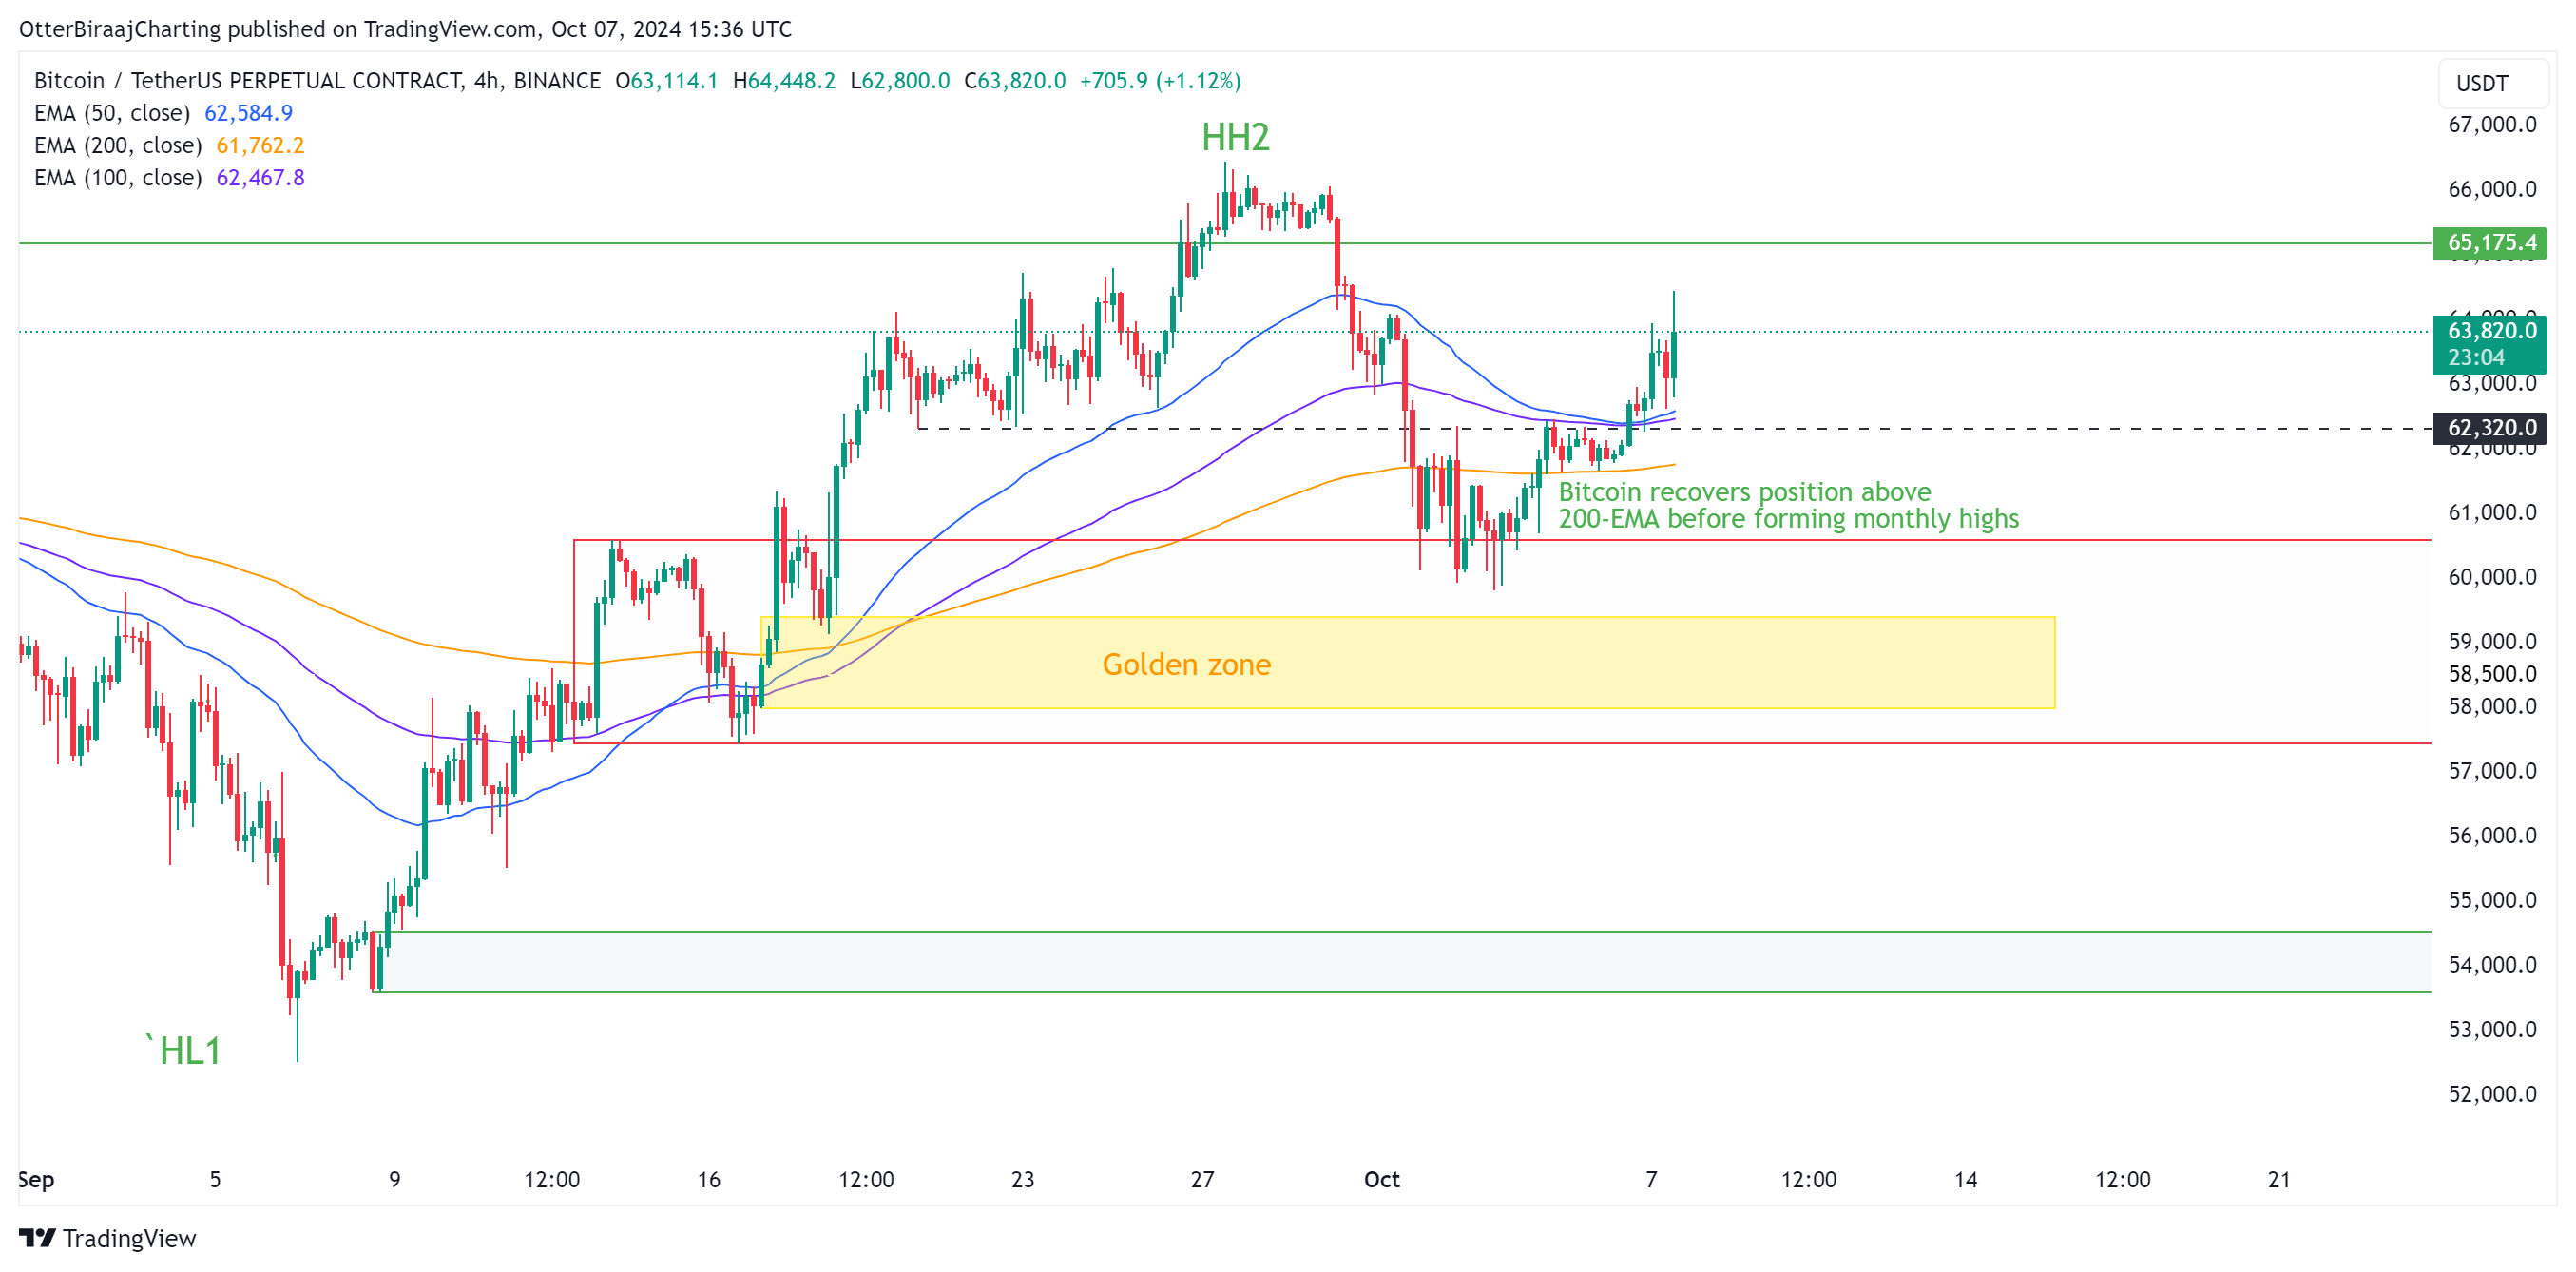
Bitcoin’s recent rally to $64,448 has reinforced a bullish trend, locking in a key technical pattern, according to analysts. After dropping to a recent low of $59,815 on Oct. 3, Bitcoin’s price surged by 7.75%, reaching its monthly high on Oct. 7. This movement confirms a trend change, with the 200-day EMA acting as a crucial support level.
Bitcoin Bullish Pattern Confirmed
Crypto analyst Jelle highlighted that the price recovery from a dip below the psychological $60,000 level has locked in a “higher low” (HL), a bullish signal when combined with a “higher high” (HH) established in late September when Bitcoin broke above $65,000. This pattern is seen as a strong indicator of an uptrend continuing.
Golden Cross in Play for Bitcoin
Another analyst, Titan of Crypto, pointed to an upcoming golden cross in the weekly chart, a bullish crossover where the 50-day moving average surpasses the 200-day moving average. Historically, this pattern has preceded significant rallies, including last year’s 145% surge.
Might interest you: What is BabyDoge?
Both analysts agree that the $60,000 level is a crucial support, and the locked-in bullish pattern suggests that Bitcoin could continue its upward trajectory, with increased optimism among traders and investors.
You can also freely share your thoughts and comments about the topic in the comment section. Additionally, don’t forget to follow us on our Telegram, YouTube, and Twitter channels for the latest news and updates.


