

The RSI Heat Map is an analytical tool that visualizes the Relative Strength Index (RSI) values of various assets in the cryptocurrency market using colors. RSI is a technical momentum indicator that measures the speed and change of price movements over a specific time period—typically calculated over a 14-day period—and ranges from 0 to 100.
With this map, investors can quickly examine the RSI levels of multiple cryptocurrencies on a single screen and easily identify which assets are in overbought or oversold zones.
RSI Values and Their Meanings
- RSI 70 and above (Overbought Zone): Assets at this level indicate that prices have risen rapidly in a short time. This typically signals that the market is “overbought,” and a price correction or pullback may soon occur. Caution is advised.
- RSI 30 and below (Oversold Zone): These assets show a significant price drop, suggesting the market is “oversold.” This often implies a potential price recovery and can signal a buying opportunity.
- RSI between 30–70 (Neutral Zone): RSI in this range indicates neither overbought nor oversold conditions. The market is indecisive, or the current trend may continue. Additional technical analysis is helpful in this range.
How to Interpret the RSI Heat Map?
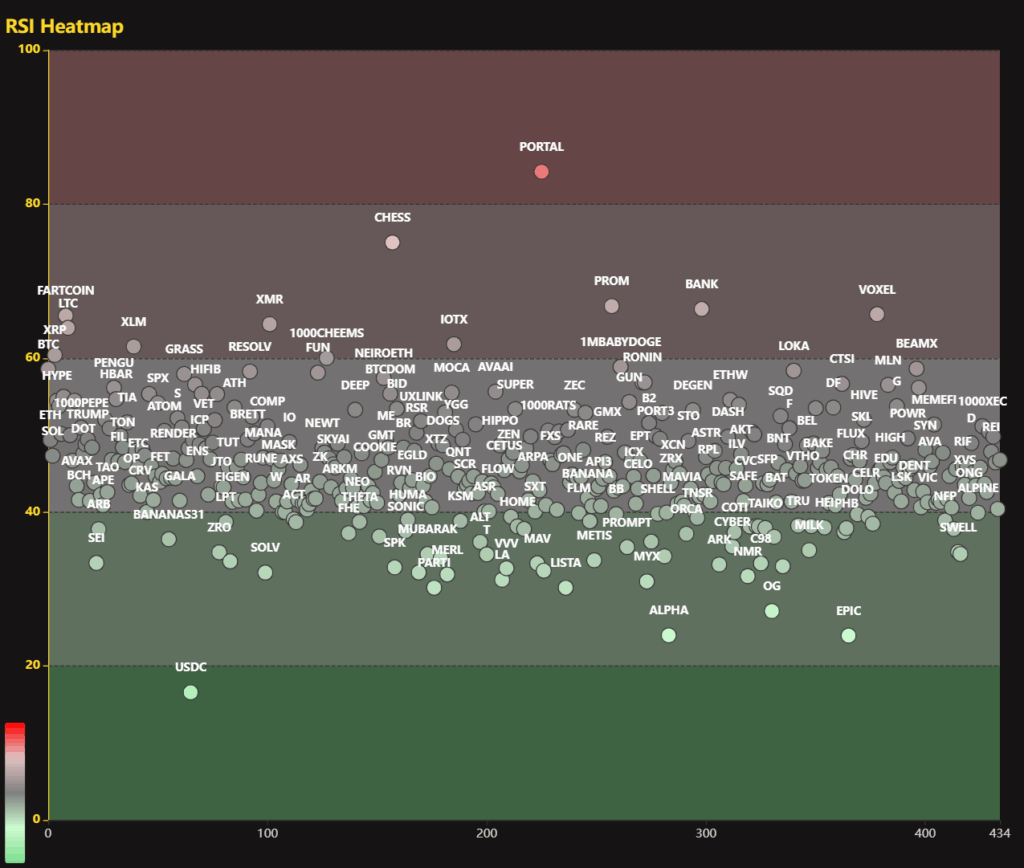
The heat map uses color codes based on different RSI values to visualize market conditions. Here’s what these colors and RSI levels mean:
- RSI 0–20 (Light Green – Oversold): Prices have dropped sharply, and the market is deeply oversold. Indicates potential bottom levels and signals recovery.
- RSI 20–40 (Soft Green – Selling Zone): Prices may still be under pressure but are moving away from oversold conditions. Selling pressure is easing.
- RSI 40–60 (Gray – Neutral Zone): The market is balanced and directionless. Neither buying nor selling pressure is dominant.
- RSI 60–80 (Light Red – Buying Zone): Assets are in a strong uptrend. Investor interest is increasing, and positive momentum dominates.
- RSI 80–100 (Red – Overbought): The market is in the overbought zone, and there’s a short-term risk of pullback or correction. Caution is advised.
Why Is the RSI Heat Map Important?
The RSI Heat Map is a critical tool that speeds up and simplifies the decision-making process for cryptocurrency investors. Here are some key reasons why it’s important:
- Quick Momentum Tracking: Investors can monitor the RSI values of hundreds of crypto assets on a single screen in real-time. This saves time and helps grasp overall market momentum quickly.
- Easily Spot Overbought and Oversold Signals: The map uses color coding to show high RSI (overbought) and low RSI (oversold) conditions. These signals help identify potential price reversal points, aiding in both risk management and spotting opportunities.
- Visualizing Market Sentiment: Changes in RSI levels across various assets reflect the overall emotional and technical state of the market. Investors can easily spot when the market is overheated or cooling off.
- Strategy Building and Quick Decision-Making: The RSI Heat Map helps investors quickly identify potential trading opportunities, leading to more informed and timely buy-sell decisions backed by technical analysis.
Critical for Risk Management: Since overbought assets require caution, the heat map helps detect risks early and allows for measures to be taken against sudden price drops.
The RSI Heat Map is a powerful tool for crypto traders and investors to monitor momentum shifts and detect potential buy-sell opportunities. Thanks to color coding, the overall market condition is easy to track, enabling smarter risk and opportunity management.
You can also freely share your thoughts and comments about the topic in the comment section. Additionally, don’t forget to follow us on our Telegram, YouTube, and Twitter channels for the latest news and updates.