


The crypto market continues its indecisive course, and the focus has shifted to the Tether Dominance chart. Recent technical movements offer clues about capital flow and market sentiment.
Support Levels Breached, Eyes On The Next Zone
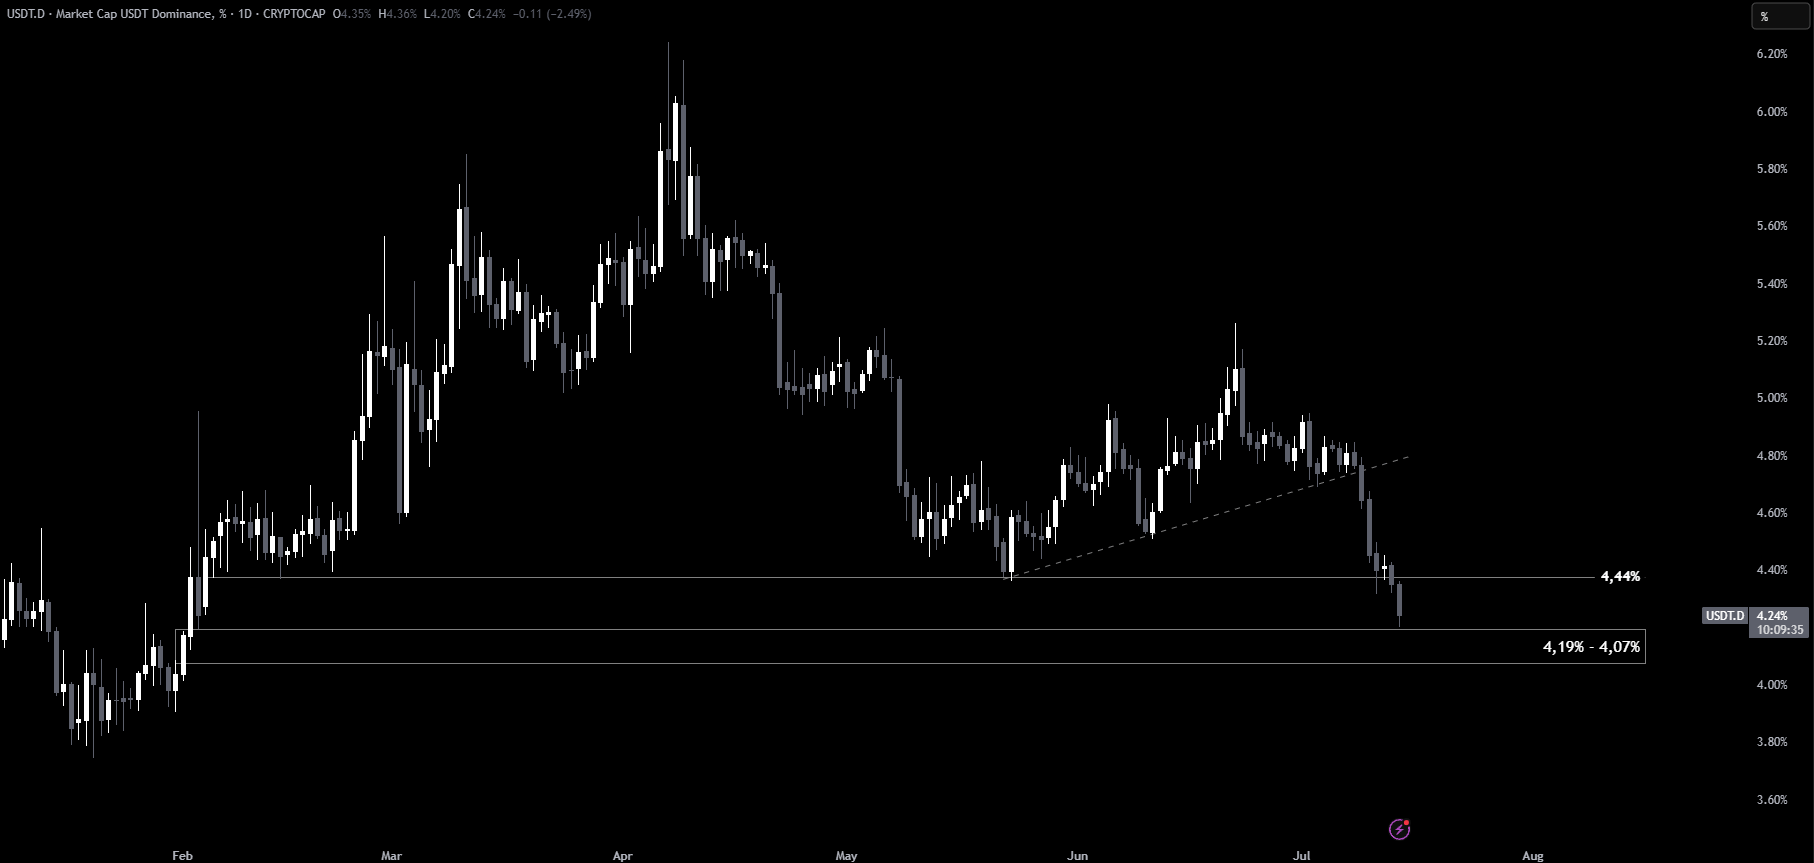
After breaking a minor upward trend on the daily chart, Tether Dominance pulled back to the 4.44% support level. Failing to hold this line, it dropped further into the critical 4.19% – 4.07% range.
You Might Be Interested In: Sonic SVM Research: Can New Stablecoins Shake Up the Old Order?
This area is seen as a key psychological zone by many traders. A confirmed break below 4.07% could push Tether Dominance down to 3.95%, which may indicate a stronger capital shift into cryptocurrencies and signal a potential rally.
Range-Bound Movement May Continue
In the short term, Tether Dominance is expected to move within the 4.07% to 4.44% band. This range-bound behavior points to a market lacking a clear direction, leading to cautious trading behavior from both buyers and sellers.
During this period, major cryptocurrencies like Bitcoin and Ethereum are likely to show sideways movement rather than strong trends. Traders should remain cautious and monitor this band closely for signs of a breakout or further decline.
You can also freely share your thoughts and comments about the topic in the comment section. Additionally, don’t forget to follow us on our Telegram, YouTube, and Twitter channels for the latest news and updates.