

As crypto markets continue to move on shaky ground, certain altcoins are standing out with their sharp short-term price movements. SUI has recently emerged as one of these assets, catching investor attention with its response to key technical levels.
How price behaves near support and resistance zones may directly influence trader sentiment and strategy.
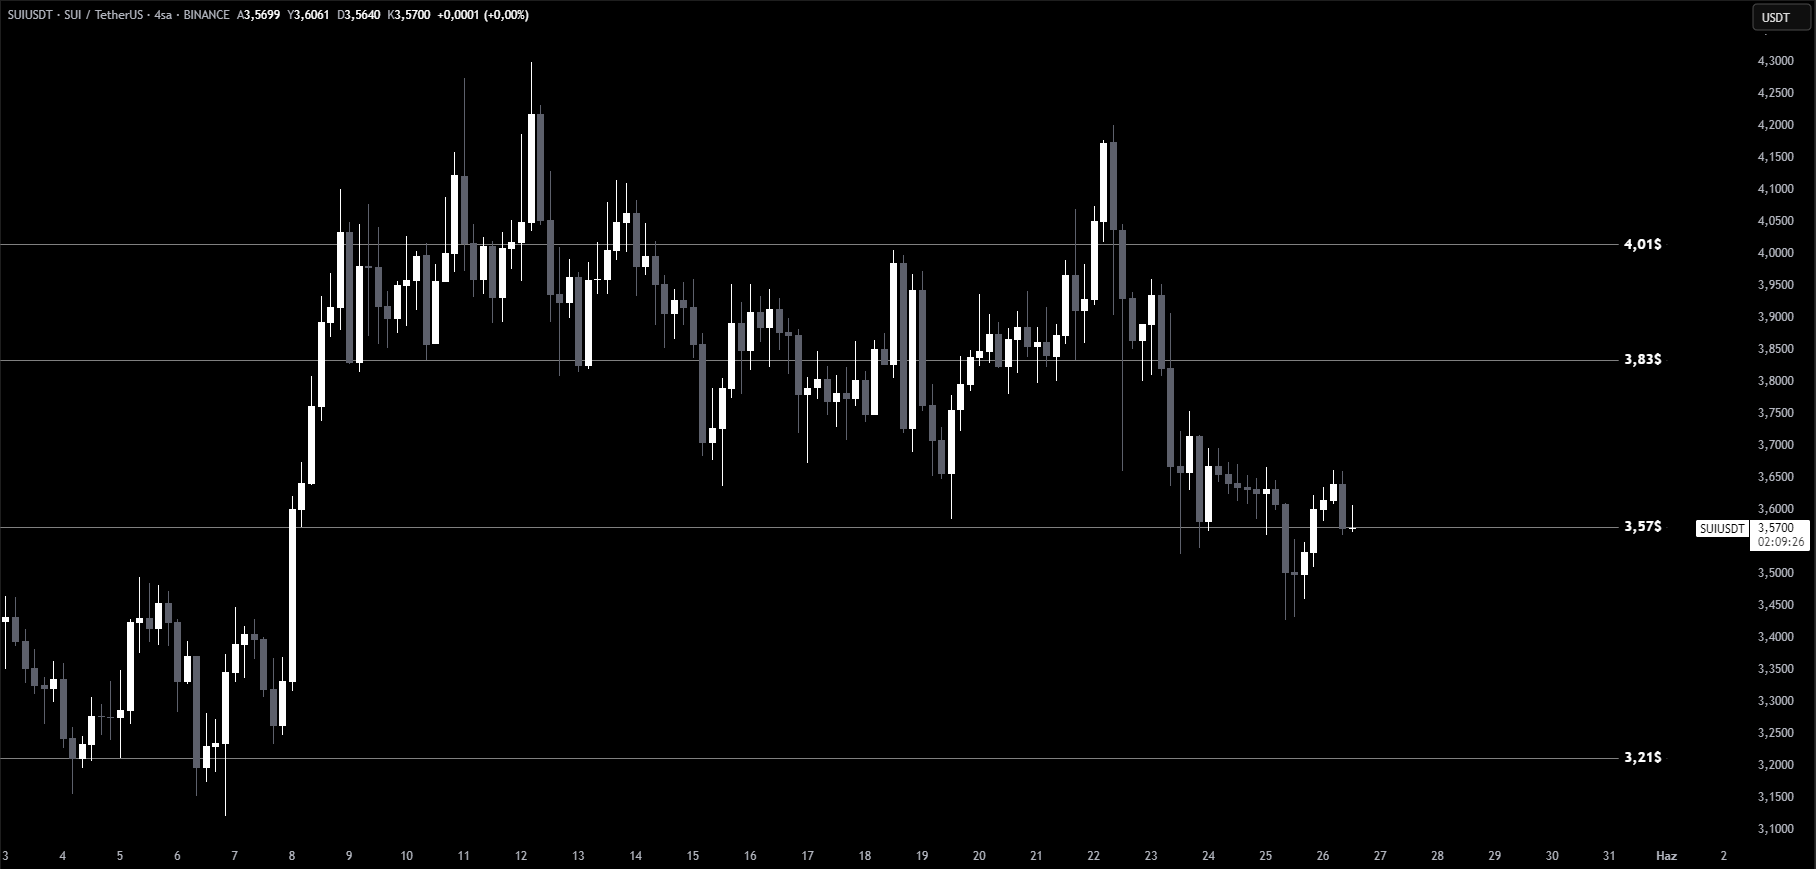
3.57$ Support Reclaimed
After losing the 3.57$ support, SUI dipped to as low as 3.41$. However, the drop was short-lived. The price quickly recovered and managed to reclaim the support zone, now hovering around the 3.57$ mark once again.
You Might Be Interested In: Elon Musk Talks About the Name of a New Memecoin!
If this level holds, a potential move toward the 3.83$ resistance remains on the table. The technical outlook supports the possibility of further upside if buying momentum continues.
Break Below Could Trigger Deeper Pullback
On the flip side, should SUI fail to maintain the 3.57$ support, a deeper correction may be in store. This would likely increase selling pressure and result in a bearish short-term structure.
Traders are advised to closely monitor both the support zone and any attempt to break through the resistance above.
You can also freely share your thoughts and comments about the topic in the comment section. Additionally, don’t forget to follow us on our Telegram, YouTube, and Twitter channels for the latest news and updates.